Bring everything together.
Every account and every asset, in one place — whatever your broker gives you.
Every broker, one portfolio
Native importers for XTB, Interactive Brokers, DEGIRO, Trading 212 and Portfolio Performance — with Coinbase, Kraken, eToro and Revolut coming next.
Beyond stocks and ETFs
Bonds, options, futures, CFDs and short positions — record them with forms built for how each one actually works.
Prices for anything
No price feed for a holding? Upload a price history from any provider and value it anyway.
Every currency
Each account in its own currency, everything reported in yours — exchange rates handled for you.
Savings & deposits
Savings accounts and term deposits next to your investments, with the interest worked out and booked for you.
RSU grants
Every grant from award to vest, with sell-to-cover and tax values recorded — and returns that stay honest.
Know where you stand.
The numbers professional fund managers use — for your whole wealth, or a single holding.
Statement of assets
Everything you own on one page, on any date you choose, with data-quality checks flagging anything that looks off.
Performance that tells the truth
Time-weighted and money-weighted returns side by side, so you see both your decisions and what your money earned.
Payments & dividends
Every dividend, coupon and interest payment, with the tax withheld broken out, month by month.
Currency exposure
How much of your wealth depends on each currency, across every account and broker.
Benchmark comparison
Your portfolio — or any holding — against 33 market indices, with excess return, beta and correlation.
Share your charts
Turn a chart into a clean image for social media or a friend — without revealing your amounts.
Research what you own.
Everything you need to understand a company, next to your own position in it.
Financial statements
Income statement, balance sheet and cash flow, with charts that make them readable.
P/E, trailing and forward
Four valuation bases on one chart — what the company earned, and what analysts expect it to earn.
Earnings, forecasts & dividends
Results against estimates, analyst targets with their full range, and the next dividend and earnings dates.
Know a company before you buy it.
The research file an analyst would write — filings, results and earnings calls read for you — in minutes, with every claim sourced and no verdict attached.
- Catalysts behind the company, past and ahead
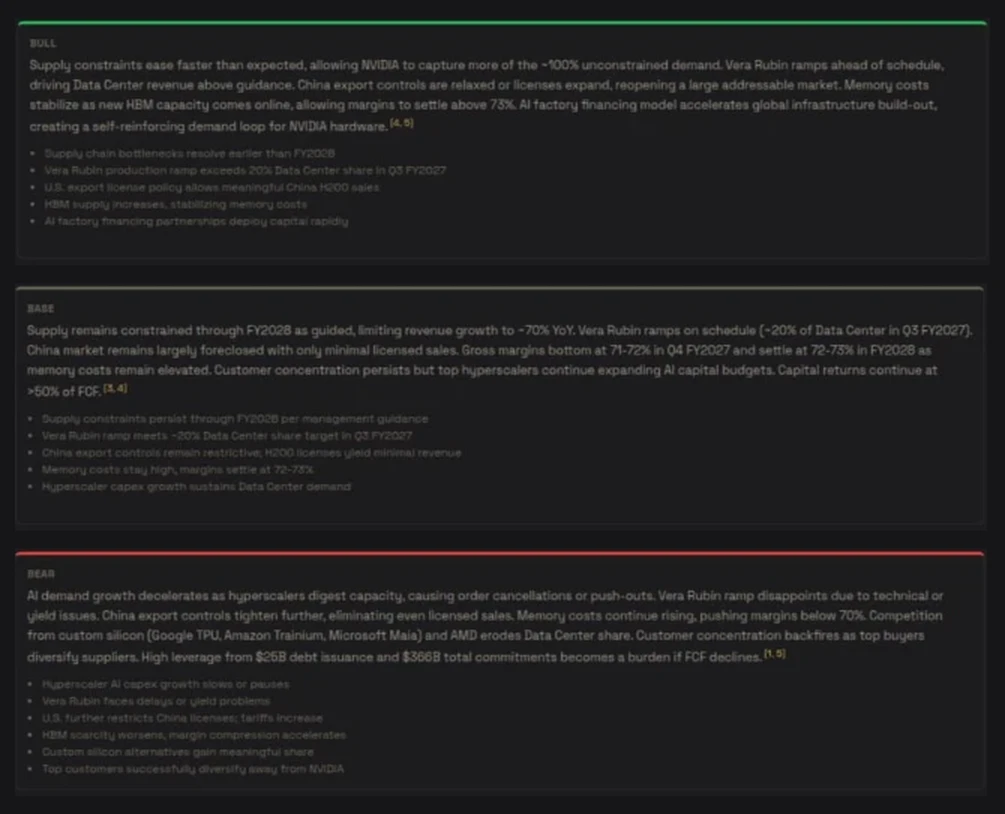
- Bull, base and bear scenarios, with what each depends on
- Seven investing lenses, from Value to Technical — and where they disagree
- Your fit: how it sits in your own portfolio
A complete 25-page sample PDF report on NVIDIA — no sign-up needed.
Plan your next move.
Decide what you want your portfolio to look like — and see what it takes to get there.
Your own classification
Group holdings by asset class, region, sector or theme — as many views as you like, with treemaps and history.
Rebalancing
Set target weights and see the exact amount and number of shares to buy or sell for each holding.
Investment plans
Recurring contributions recorded for you, so your history stays complete without re-entering each one.