An AI-written research report on any security: what the company does, what could move it, and how different investing disciplines would read the evidence — plus how it fits your own portfolio. It informs your judgement; it never replaces it.
An AI Security Report gives you the research file an analyst would put together. The company’s filings, results and earnings calls are read for you; its figures are checked against FolioCenter’s financial data; and the evidence is read through seven investing disciplines. Every claim carries a numbered source, so you can check anything that matters to you.
What it never contains is a verdict. There’s no rating, no score, no target price, and no buy, sell or hold. Where the evidence disagrees with itself, the report shows you the disagreement instead of settling it — because the decision is yours, and it depends on things only you know.
See a complete report. Download our 25-page sample on NVIDIA, produced 29 August 2026 — everything this guide describes, in full. Download the sample (PDF, 0.6 MB) →
Figures you can rely on. Every number in a report comes straight from FolioCenter’s financial data — the AI never types a figure — and stays exactly as it was on the day the report was produced, so what you read always matches what was true then.
The company, in its own terms
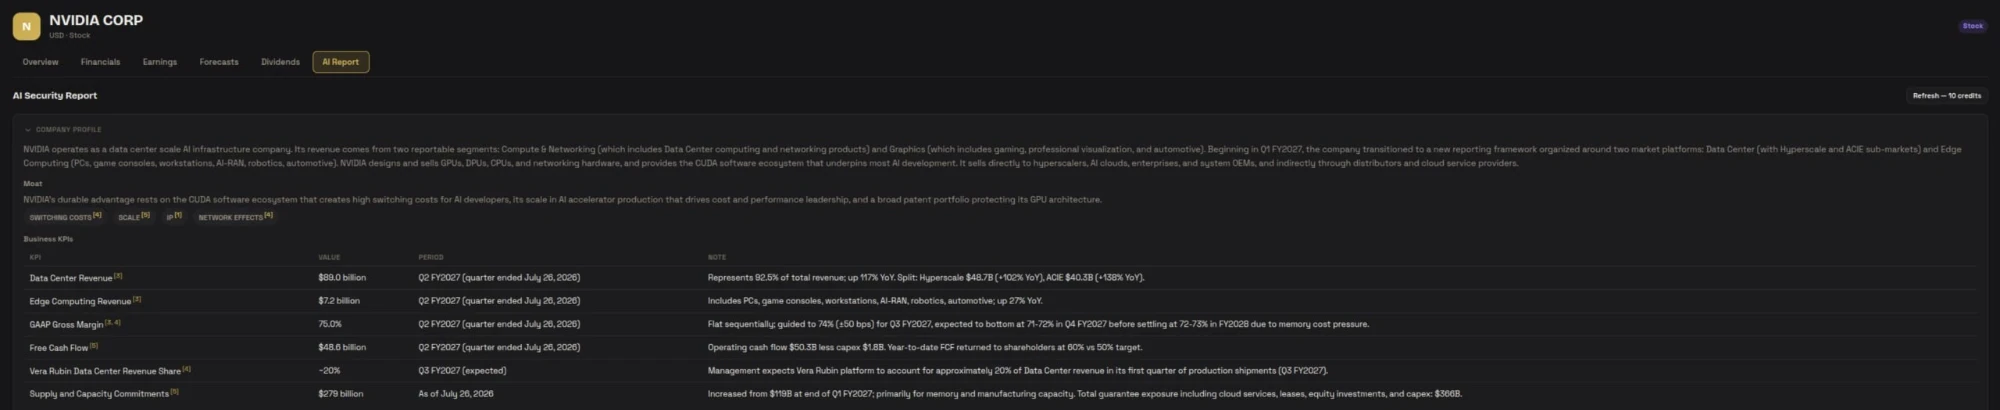
The report opens with a company profile: what the business does and how it makes money, its moat tagged by type (switching costs, scale, IP, network effects), the business KPIs that matter for this particular company, its competitors, and a guidance record — what management promised, when, and whether it was met. A concentration block names the dependencies that rarely show up in a ratio: customers, geographies and suppliers. Segments then show where revenue and profit actually come from, and how fast each part is growing.
The opening of a report: profile, moat, KPIs, competitors, guidance record and concentration. Click to enlarge. Example: NVIDIA, report generated 26 August 2026.
Catalysts and scenarios
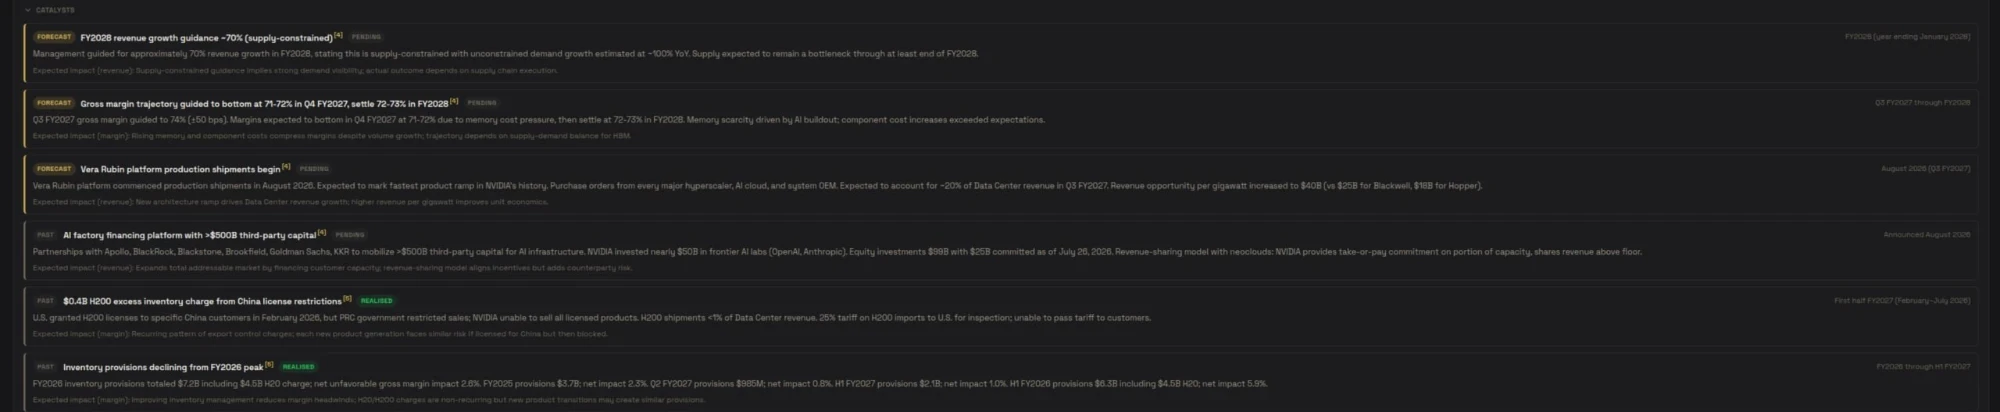
Catalysts are the core of the research: the events that have moved the company and the ones ahead that could. Each is dated, marked as past or forecast, tagged with its status — pending or realised — and carries its expected impact on revenue, margin, cost or share count. Read the past ones as a track record and the forecast ones as a checklist: the next results will tick some of them off.
Catalysts, newest first: guidance and product ramps still pending, and past events marked as realised. Click to enlarge. Example: NVIDIA, report generated 26 August 2026.
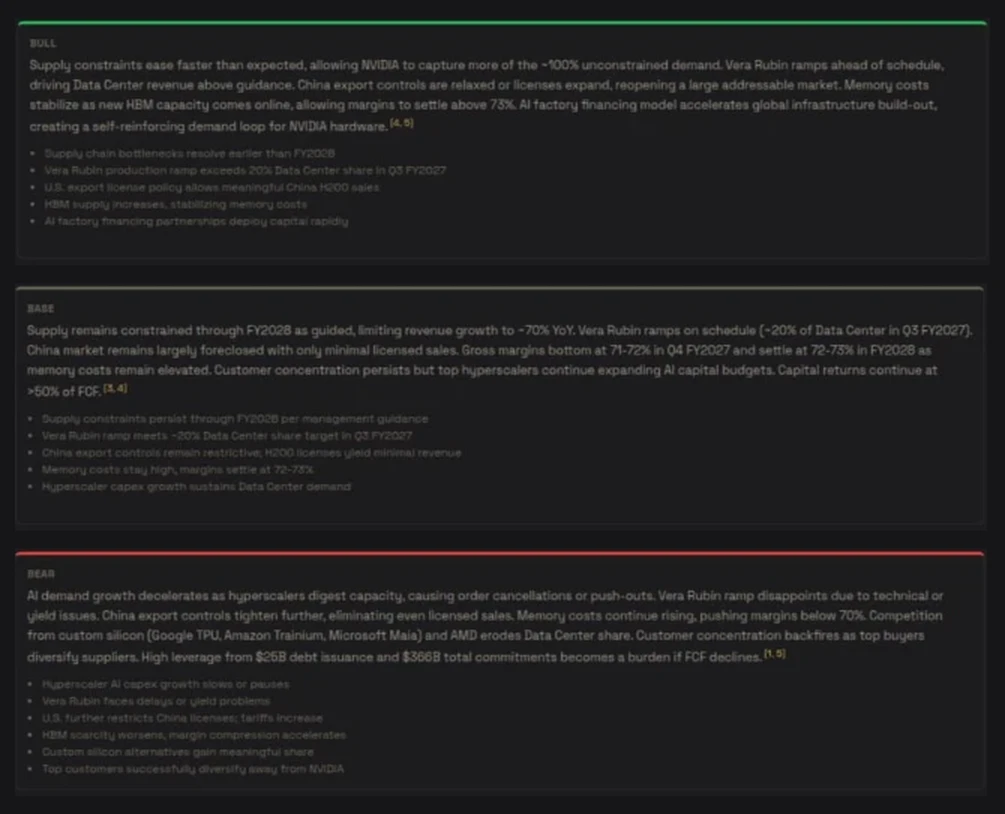
Scenarios then compose those catalysts into bull, base and bear outcomes. Each lists the conditions it depends on, which is the useful part: instead of asking which story you believe, you can watch for the specific things that would make each one true.
Three scenarios, each with the conditions it depends on. Example: NVIDIA, report generated 26 August 2026.
Seven lenses on the same evidence
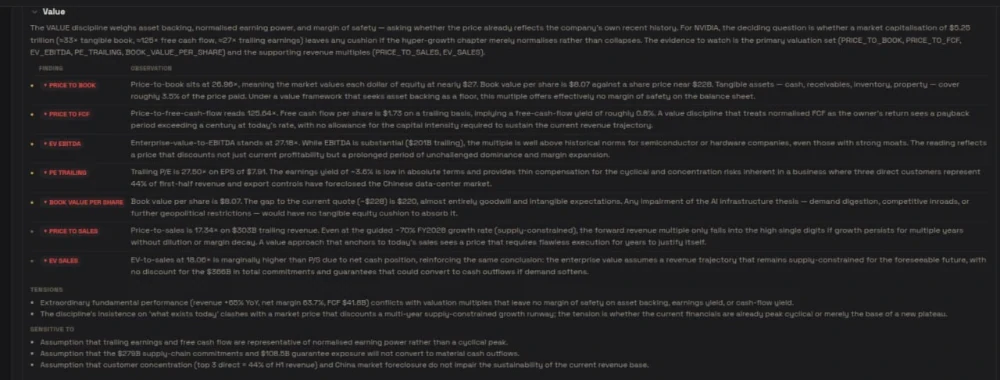
The heart of the report reads the same company seven times, as seven disciplines would: Value, Growth, Income, Quality, Risk, Expectations and Technical. Each lens opens with the question that decides it for this company, lists its findings metric by metric — marked as supportive (▲), concerning (▼) or neutral for that lens — and closes with two short lists:
Tensions — where the evidence pulls in opposite directions.
Sensitive to — the assumptions the reading depends on. If one of them changes, so does the reading.
A lens that doesn’t apply says so. A company that pays no dividend gets no Income reading rather than an invented one.
The Value lens. With price at roughly 27× book, 126× free cash flow and 28× trailing earnings, every finding reads as concerning for this discipline. Example: NVIDIA, report generated 26 August 2026.
The lenses are meant to disagree. In the same report, the Growth lens reads a PEG of 0.59 as consensus pricing in continued hyper-growth with little room for deceleration — a very different conversation from the Value lens above, about the same share price. Neither is the answer. The question the two raise together — how long can growth at this rate last? — is the one worth your time.
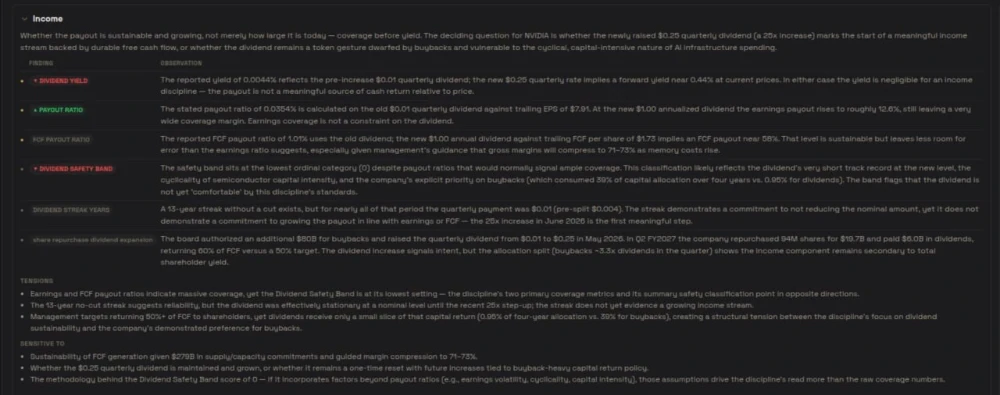
The Income lens. Payout ratios suggest ample coverage while the dividend safety band sits at its lowest setting, and the report names that tension rather than averaging it away. Example: NVIDIA, report generated 26 August 2026.
The report then lists the main risks on their own, and ends with its sources: the numbered documents every superscript in the text points to, each with its date.
Every superscript in the report points to one of these. Example: NVIDIA, report generated 26 August 2026.
Your fit
The last section is the only part written for you, and it is recomputed every time you order: your position and its result, where the security sits in your own taxonomy and how that category compares with your target, its currency against your fund’s, and a comparison against the benchmark you chose. It is arithmetic, not advice — this sits in Technology, which is 34% of your fund against a 25% target, never you should trim.
The benchmark comparison runs over several windows and goes further than a single return:
Beta — how far the security moves for each move of the benchmark.
Correlation — how reliably they move together.
Tracking error — how far apart their paths typically drift in a year.
Up and down capture — how much of the benchmark’s rising days, and of its falling days, the security tends to share.
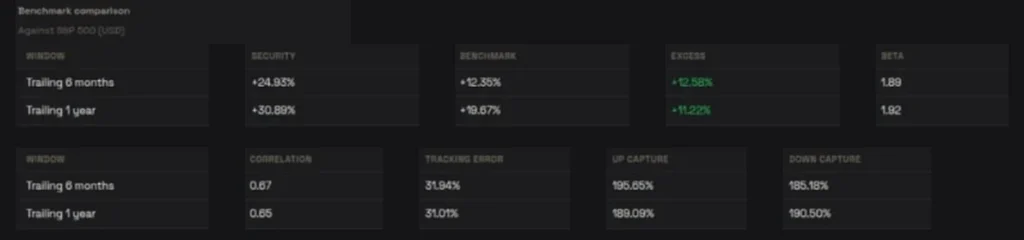
Against the S&P 500: a beta near 1.9, with up-capture near 196% and down-capture near 185% over six months (columns rearranged to fit this page). Example: NVIDIA, report generated 26 August 2026.
Read the captures together. Up-capture of 196% says the stock rose about twice as much as the index on the index’s good days; down-capture of 185% says it fell almost twice as much on the bad ones. That is leverage to the market, not protection from it — worth knowing before deciding how much of a portfolio it should be. When a security and its benchmark move too independently for a slope to mean anything, the report prints not meaningful for beta and the captures rather than a misleading number. Our guide to benchmarks explains each measure in depth.
Order a report
Open any security and go to the AI Report tab.
Choose Order report — 10 credits.
Pick the benchmark and the taxonomy to measure your fit against, and confirm.
The report is prepared in a few minutes. You can follow its progress, or come back later.
You pay for a version, not a view. Reopening a report you own is free and unlimited. Refresh produces a new version for the same price, and every earlier version stays available from the version picker. If a report can’t be completed, your credits are returned.
Reading it well
Start with the tensions. They are where the real decision lives. A report with none is describing an easy company — or a question you haven’t asked yet.
Follow the sources behind the claims your decision rests on. A guidance figure from an earnings call deserves a look at what was actually said.
Check the date. Catalysts get realised and guidance gets revised. When something material happens, refresh.
Cross-check the figures on the Financials and Earnings tabs, and read valuation alongside our guide to P/E and forward P/E.
No. A report is a snapshot of the day it was produced. Refresh it whenever you want a new one; your earlier versions stay available.
Research your next idea in minutes
Open any security in FolioCenter and order an AI Security Report — the company, its catalysts and seven expert lenses, plus how it fits your portfolio.
This report was written by AI. Every claim is tied to a listed source, but errors and omissions are possible. Treat it as research to check, not a conclusion to act on. Not investment advice: no recommendation to buy, sell or hold, and your circumstances are not taken into account.