P/E vs forward P/E
Two ways to divide a share price by earnings — one uses profits already reported, the other what analysts expect. The gap between them is often the most useful number on the page.
Four lines, two questions
FolioCenter plots four valuation bases on one chart. Two look backwards: Last FY, the last full financial year a company reported, and TTM, the trailing twelve months, which rolls forward each quarter. Two look ahead: Current FY est. and NTM est., built from analyst consensus for the current financial year and for the next twelve months.
The backward pair is arithmetic. Reported earnings, divided into today’s price — two people looking at the same company get the same number. The forward pair is a forecast wearing the same units. Read side by side, they answer different questions: what has this company earned against what I pay for it, and what is it expected to earn.
Where trailing P/E is the right tool
Its strength is that nobody’s opinion is in it. Last FY and TTM come from filed accounts, so a multiple that looks low is low against profits that actually happened. For a mature, predictable business that is usually all you need — history and expectations tell the same story, and the forward figure adds nothing you did not already know.
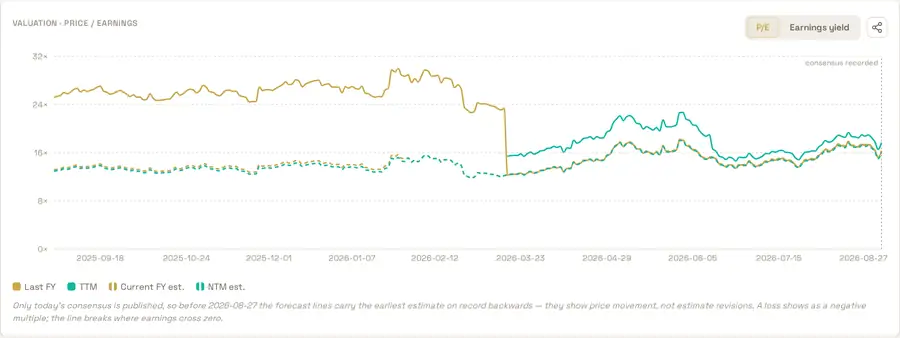
Its weakness is staleness, and the same chart shows it plainly. Look at the step in March: Last FY drops from about 24× to 13× in a single day, with no news and no move in the price. Nothing changed except which financial year sits in the denominator. A figure that can halve overnight because a filing was published is a blunt instrument for judging what something is worth today.
Where forward P/E earns its keep
It prices the business you are actually buying. When earnings are growing quickly, collapsing, or recovering, the last twelve months are a poor guide to the next twelve. And for some companies the trailing figure is not merely stale — it is meaningless.
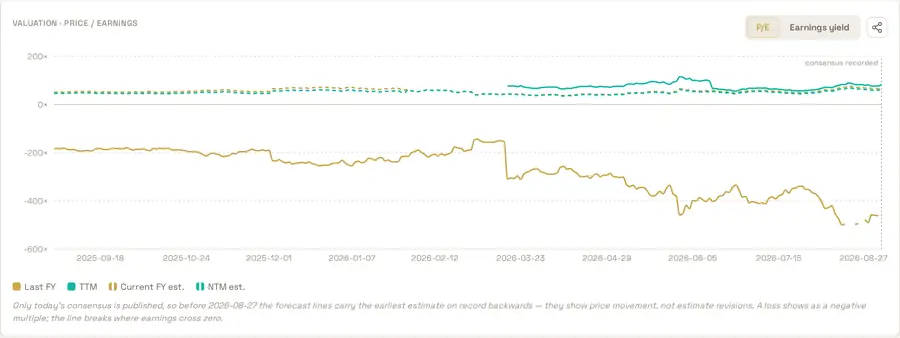
A negative P/E is not “cheap”; it is the ratio telling you it has stopped working. Screen this company on trailing earnings and you either exclude it, or rank it as the cheapest thing you own. The cost of looking forward is that consensus is an opinion — estimates get revised, analysts tend to begin a forecast year optimistic, and the further out an estimate reaches, the more of it is judgement.
When the two disagree
The gap is the signal. A forward multiple well below trailing says the market expects earnings to grow into the price. A forward multiple above trailing says the opposite — earnings are expected to fall, and the trailing figure is flattering the shares.
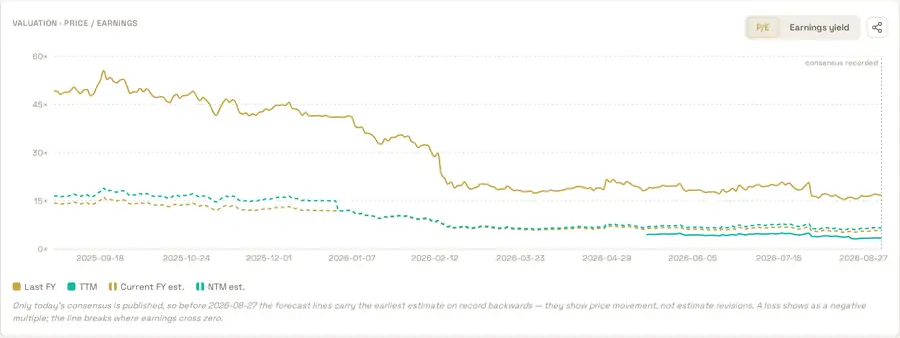
Fiverr is the case that catches people out, because the cheap-looking number is the wrong one. The two backward measures disagree with each other — around 17× on the reported year against roughly 3× on the trailing twelve months — and that disagreement is itself the tell that something non-recurring has landed in the recent window. The forward estimates strip it out and settle near 7×.
What the gap is really telling you: growth
Everything above treats the four bases as separate measurements. They are also a single statement about growth. The multiple you pay is a claim about earnings that have not happened yet — and the slope from TTM through Current FY est. to NTM est. is that claim made explicit. Read the three charts above again with only the slope in mind:
- Zoom · 17.7× → 16.3× → 16.0× — almost flat. The market expects next year’s earnings to look much like this year’s.
- MongoDB · 83× → 72× → 65× — a descending ladder. Each step down is earnings growing into the price.
- Fiverr · 3.4× → 5.7× → 6.6× — an ascending ladder, which is the market pricing a decline.
Three things follow, and most P/E mistakes live in them.
A high multiple is not “expensive” — it is a forecast. Paying 65× for MongoDB is a statement that earnings will grow enough to make 65× look reasonable in hindsight. The question is never whether the number is high; it is whether the growth implied by it is plausible.
Comparing multiples only works at similar growth rates. Ranking a 16× business against a 65× one and calling the first cheaper compares two different claims about the future. The crude bridge is to divide the multiple by the expected growth rate — the PEG ratio — which is a useful sanity check and an unreliable verdict: it flatters companies whose growth cannot last, and it breaks down entirely as growth approaches zero.
Growth has to last. A low forward multiple on a business whose growth is about to stop is not cheap; it is correctly priced. This is the cyclical trap. At the top of the cycle a miner or a chipmaker shows peak earnings, and both the trailing and the forward multiple look flattering at once — the multiple is lowest exactly when the earnings are least repeatable.
How good are these estimates?
If a forward multiple is a forecast, the honest next question is what the forecast is worth. Two things are worth separating. Company guidance is management’s own projection, issued alongside results. Analyst consensus is the average of the analysts covering the stock, and it is what the forward bases on this chart are built from. The two are related — analysts anchor to guidance — but the incentives behind them are not the same.
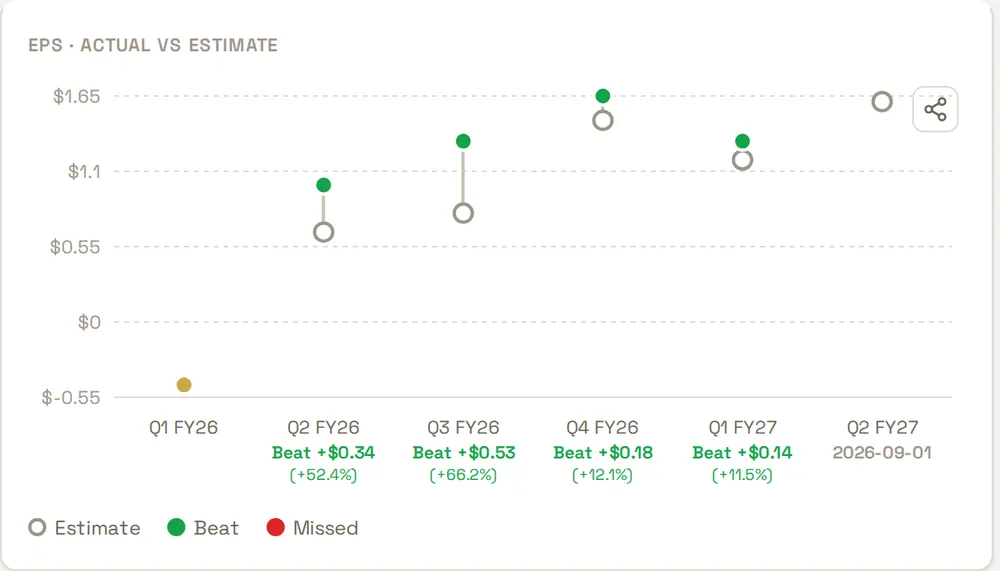
That pattern is not unusual. Across the eleven covered holdings in this catalogue, 30 of the last 44 reported quarters beat consensus — 68%. A beat rate that far above half is not evidence that companies routinely outperform. It is evidence that the bar is set to be cleared: guidance tends to be conservative, consensus drifts toward it, and “beating expectations” becomes the ordinary outcome rather than news.
It is not universal, and the exceptions matter. Over the same window Airbnb averaged −6.3% against estimate and Netflix −3.6%. A company that misses repeatedly is telling you something a single multiple will not.
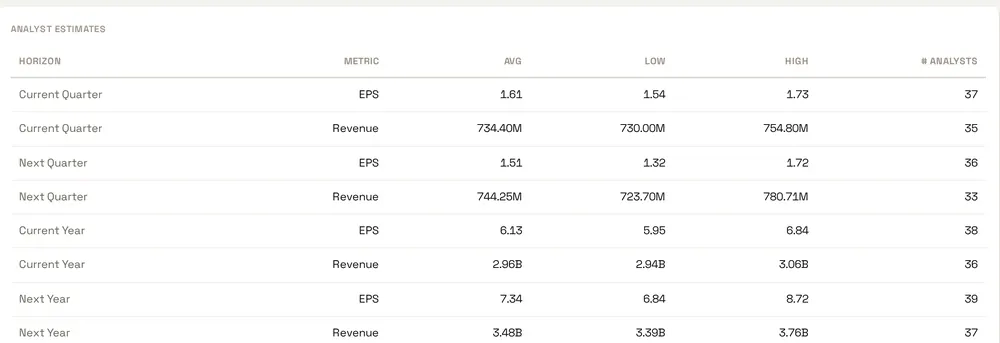
It is worth opening that table before trusting any forward number, for three reasons.
Confidence decays with horizon. For MongoDB, this year’s EPS consensus spans 5.95 to 6.84 — about 15% of the average. Next year’s spans 6.84 to 8.72, roughly 26%. The estimate reaching further out is not just less certain in principle; you can measure by how much.
Coverage depth varies enormously. Thirty-odd analysts stand behind each MongoDB figure. Elsewhere in the same catalogue, Brookfield Renewable’s consensus rests on one. A forward multiple built on a single model is one analyst’s spreadsheet with a decimal point on it, and it should not carry the weight of one built on thirty.
The spread is the confidence interval. Zoom’s analysts sit within about 8% of each other; Fiverr’s span 34%. Both collapse into one tidy forward P/E, and the tidiness hides the difference.
A final echo of the negative-multiple problem: surprise percentages break down near zero earnings for exactly the same reason multiples do. Brookfield Renewable’s average “surprise” across four quarters computes to −1769% — arithmetic noise, not information.
Which to prefer, by holding
- Mature, profitable, predictable — consumer staples, utilities, established industrials. Trailing P/E is enough; the forward figure rarely disagrees.
- Fast-growing or newly profitable — software, biotech. Forward. Trailing earnings are small, volatile or negative, so the multiple is unstable or undefined.
- Cyclicals — miners, semiconductors, autos, shipping. Trust neither alone. Trailing P/E looks lowest at the top of the cycle, when earnings are peaking.
- Anything with a recent one-off — an asset sale, a tax settlement, a write-down. Forward, always: TTM carries the distortion for four full quarters.
- Loss-making — neither. P/E has no meaning without positive earnings; reach for sales or gross-profit multiples instead.
- Banks and insurers — trailing P/E works, but book value is usually the better lens.
- REITs and property — avoid P/E entirely. Accounting depreciation distorts reported earnings; use FFO or NAV.
One rule cuts across all of them: a multiple only means something next to a comparison — the same company’s own history, or a close peer. 12× is neither cheap nor expensive until you know what this business, or one like it, usually trades at.
Reading the chart honestly
Only today’s consensus is published, so before the most recent date the forecast lines carry the earliest estimate on record backwards. They move with the price, not with estimate revisions. Read the historical part of a forward line as what this multiple would have been at that price — not as a record of what analysts believed at the time.
That is the annual report landing. The denominator switches to the new financial year all at once, so the multiple steps rather than drifts. It is an artefact of reporting, not a change in the business — which is exactly why a trailing multiple can mislead in the weeks before a filing.
Earnings crossed zero. Rather than plot a meaningless value the line breaks, and a loss shows as a negative multiple. Treat that as a signal to stop using the ratio, not as a bargain.
For a mixed portfolio, neither on its own. Screen on both and look at the gap: a large discrepancy is usually telling you something specific — growth, decline, or a one-off — that a single multiple would hide.
Yes. The toggle at the top right of the chart flips every basis to its reciprocal, the earnings yield. That form is easier to compare against a bond yield, and it behaves more gracefully as earnings approach zero.
See all four P/E lines for the companies you follow
Every security in FolioCenter shows trailing and forward P/E on one chart, with the analyst estimates behind them.
Start free →Already have an account? Sign in
Last FY and TTM are available on every FolioCenter plan; the two consensus bases, Current FY est. and NTM est., come with Plus. Whichever you use, a multiple is a starting point for research rather than a verdict — this guide is about reading the app and isn’t investment advice.