Your wealth at a glance.
The numbers that change how you act — and the chart that shows how your wealth grew.
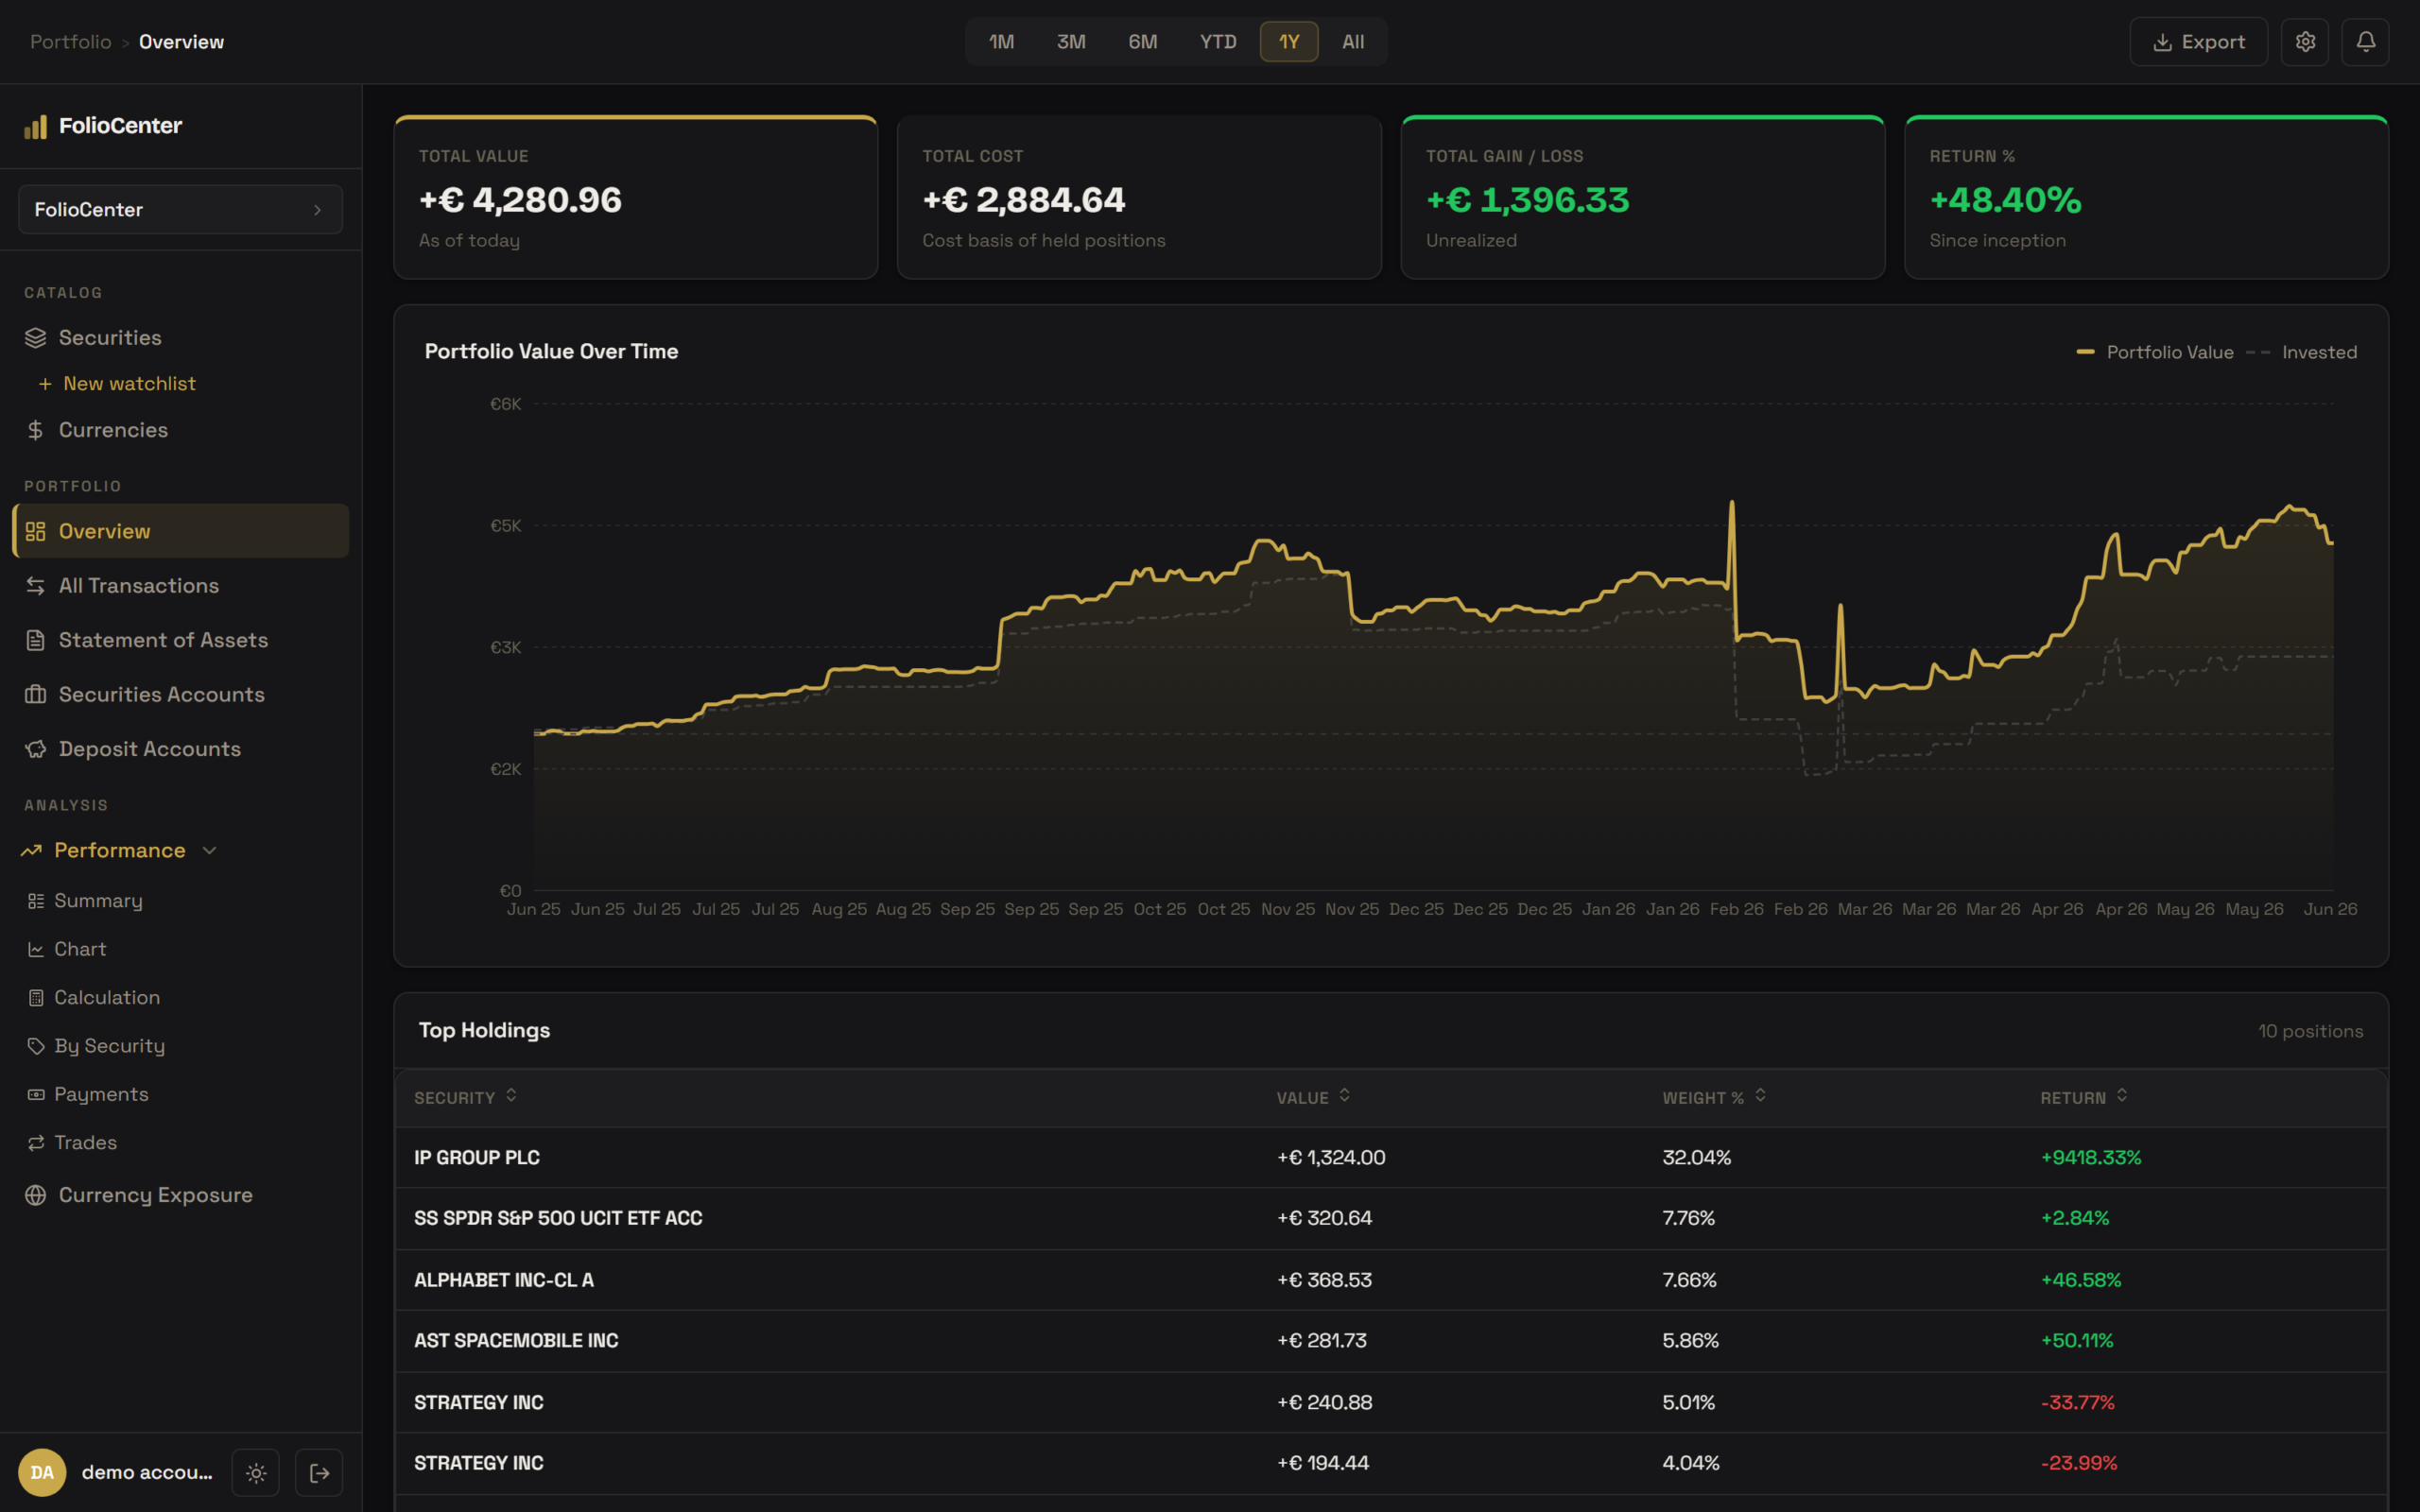
Four KPIs, not forty
Value, cost, gain and return — no vanity metrics.
One base currency
Everything in your currency, exchange rates handled.
Growth vs contributions
Portfolio value against what you put in, so the two are never confused.
Holdings · statement of assets.
Every position, consolidated across brokers and currencies. Sort by any column and drill into the transactions behind it.
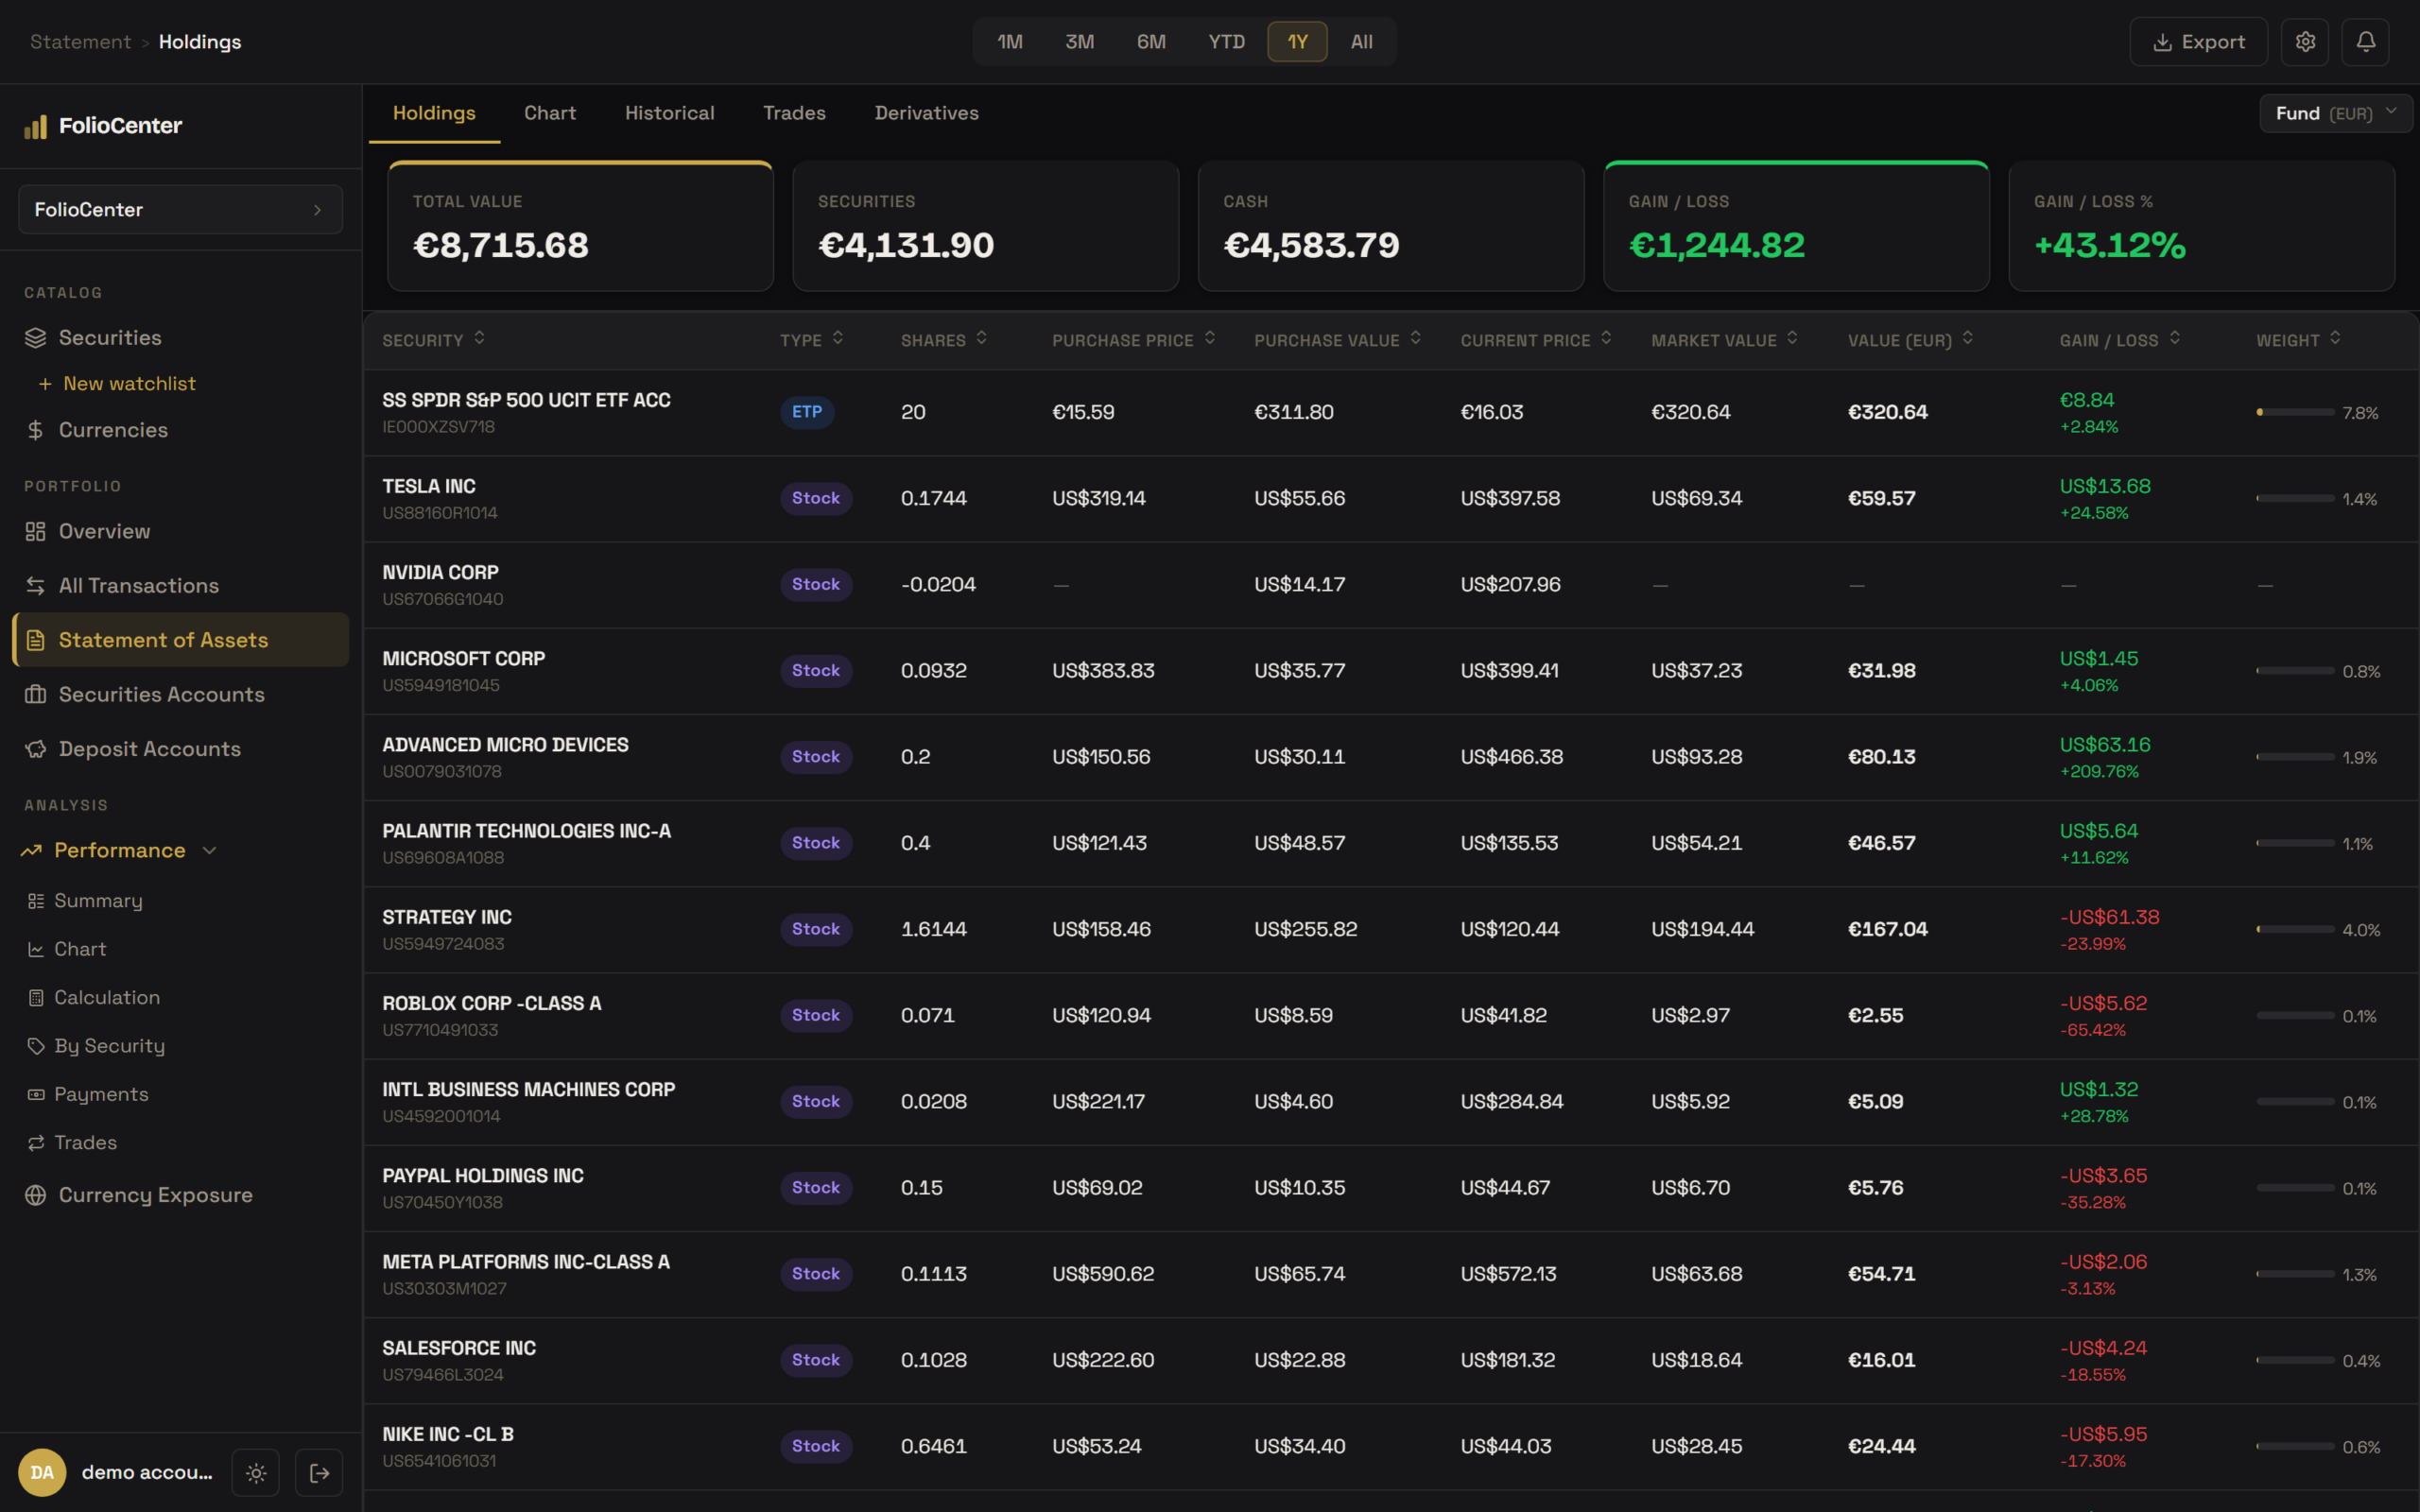
Cross-broker
The same security at two brokers, combined automatically.
True cost basis
FIFO cost in your currency, at the exchange rate you actually paid.
Drill down
Click any row for its full transaction history.
Performance · TWROR + IRR.
The two return numbers that actually mean something, on every period and every level of your portfolio.
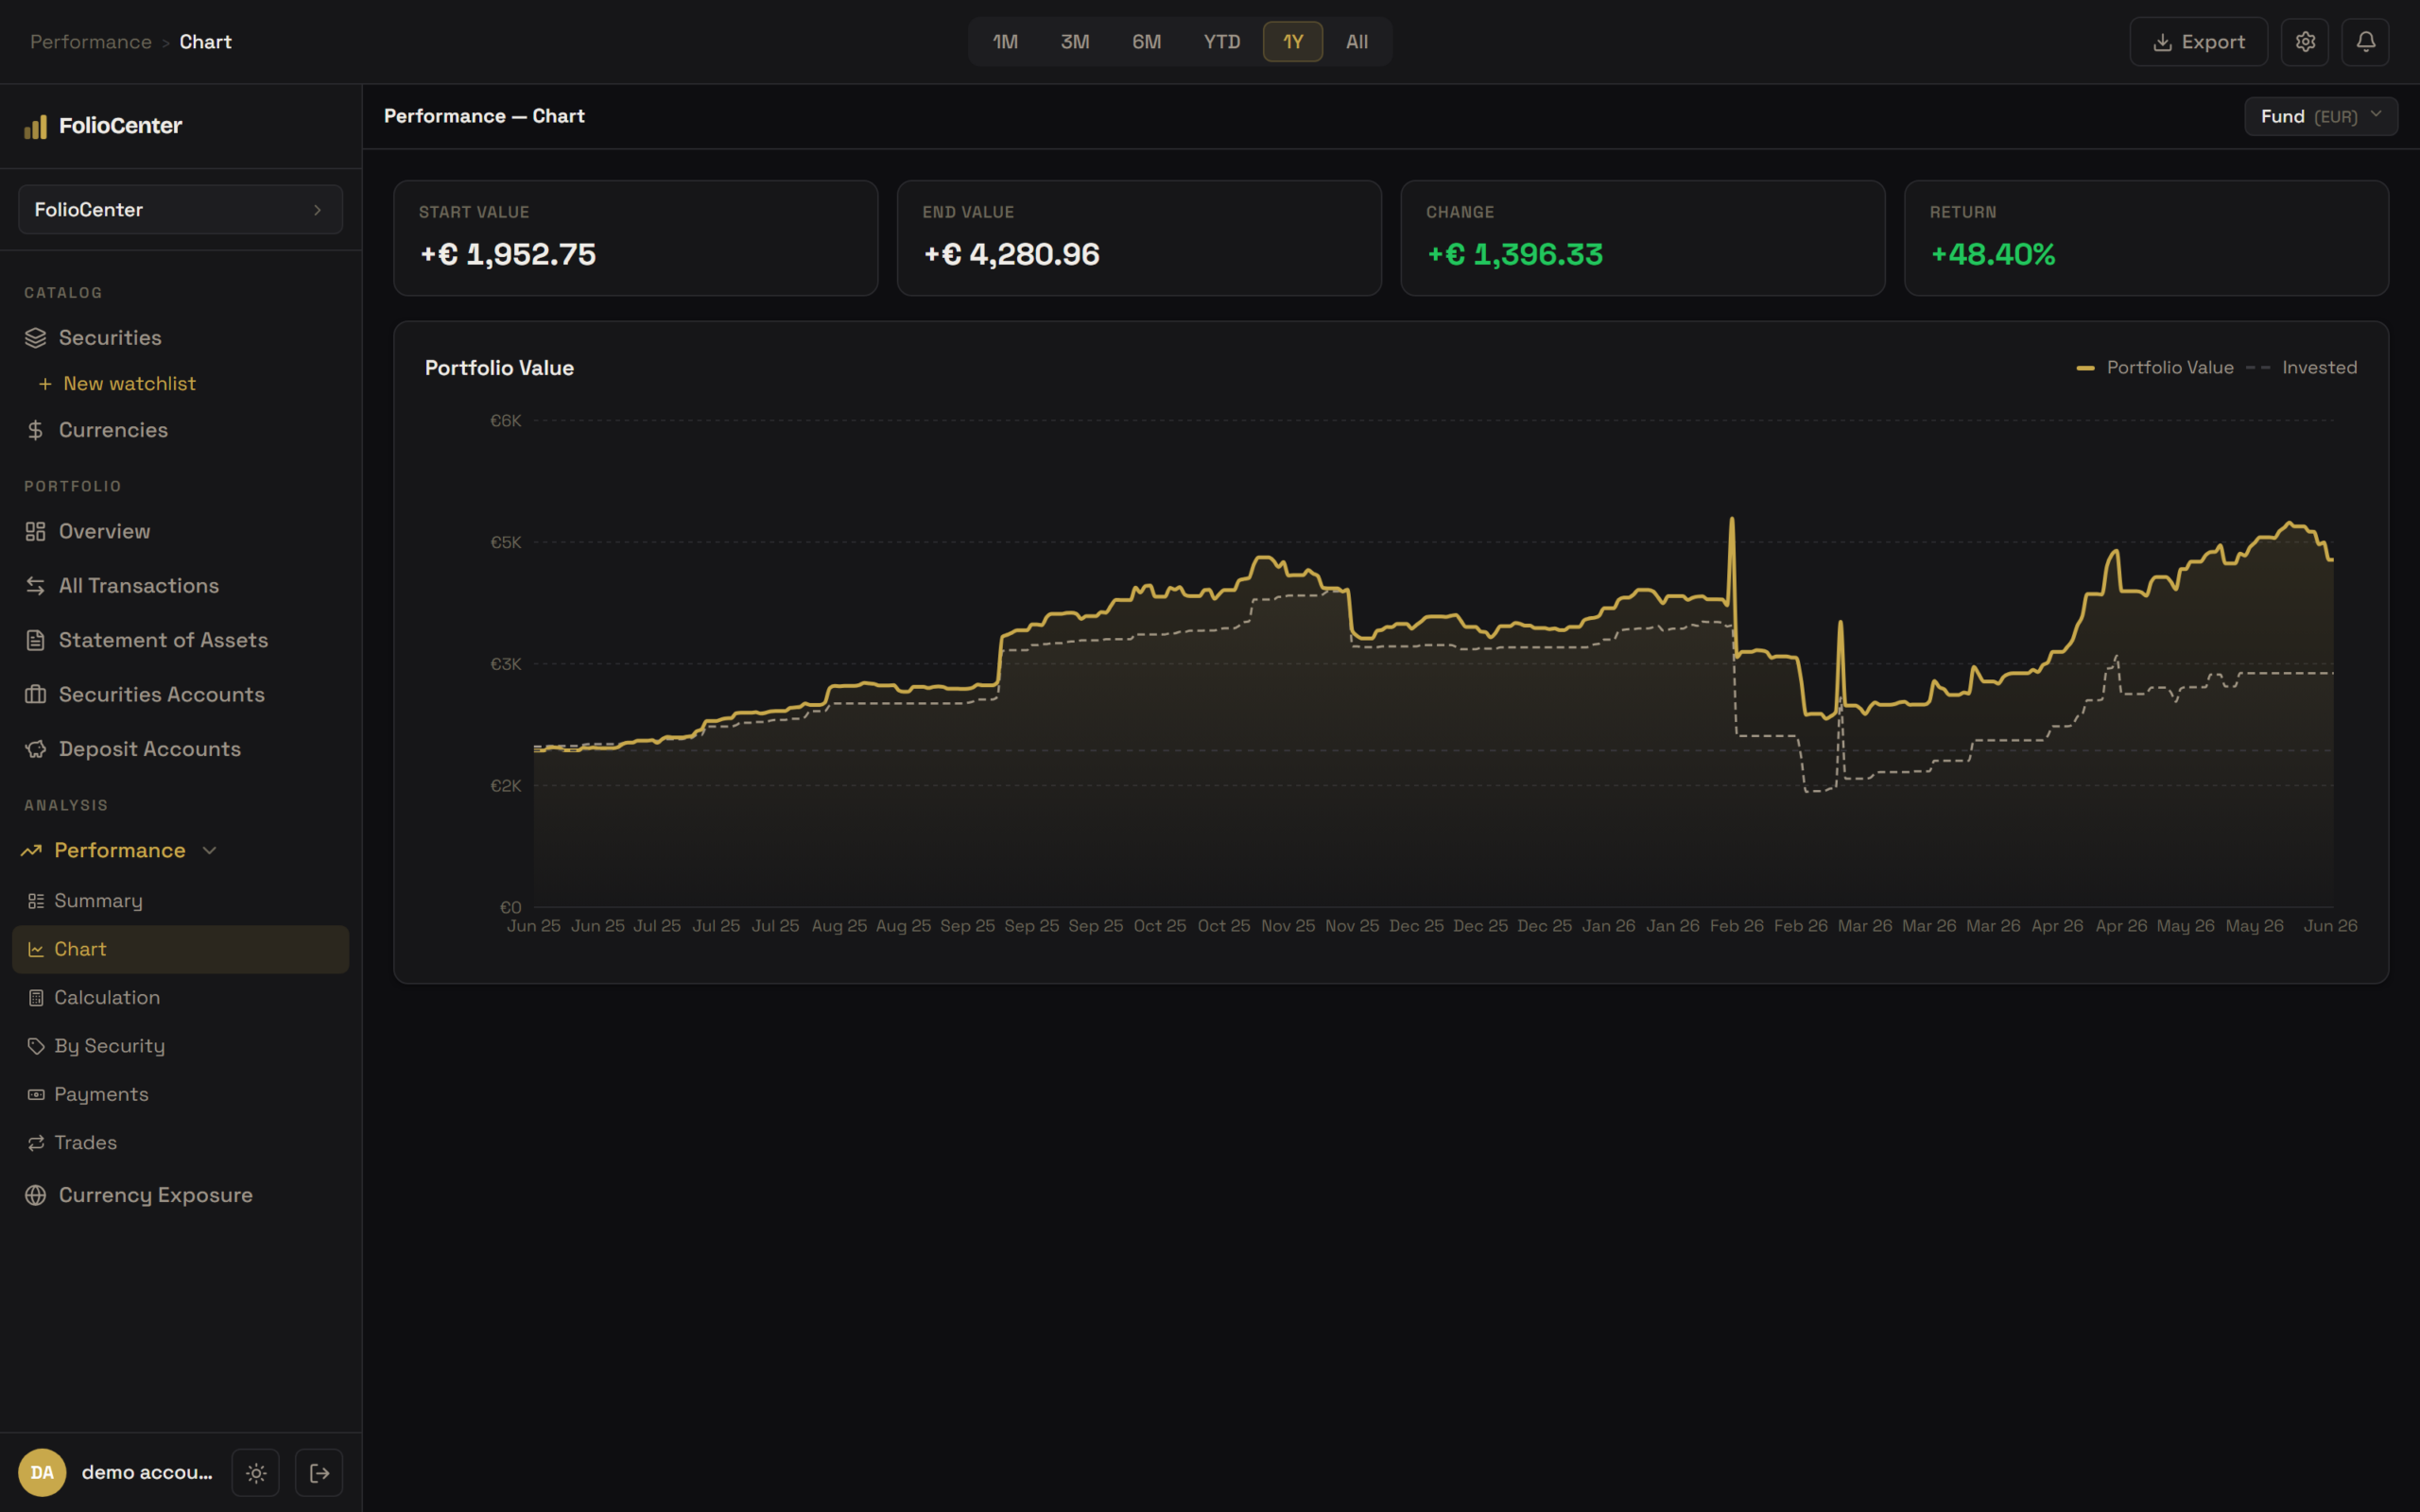
TWROR measures decisions
Your deposit timing doesn’t distort how well you invested.
IRR measures money
What your actual euros earned, given when you put them in.
Any level
Whole fund, portfolio, account or single holding.
Benchmark comparison.
Your returns next to the market’s — so you know whether your choices are paying off.
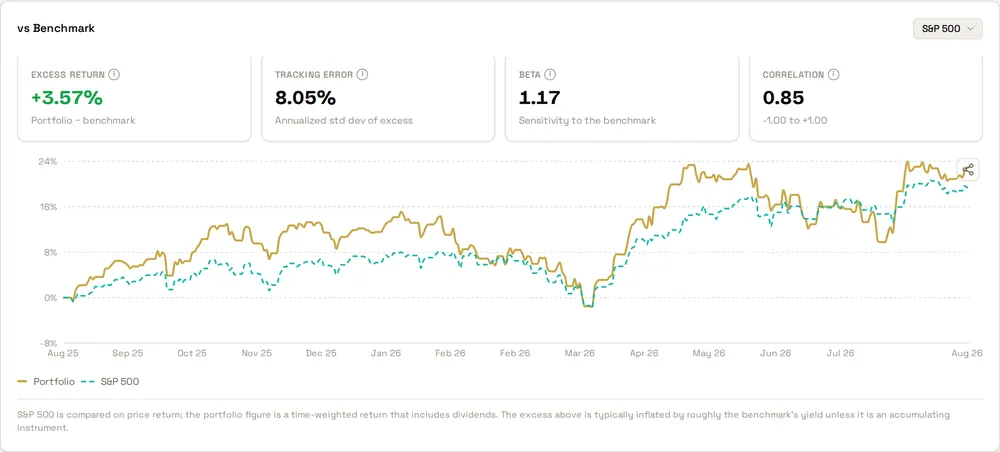
33 benchmarks
Global, US and regional indices — MSCI World to the PSI 20.
In your currency
The benchmark converted, so the comparison is fair.
Beyond return
Excess return, tracking error, beta and correlation.
Payments · dividends & coupons.
Every cash payment from every position, with the tax withheld broken out.
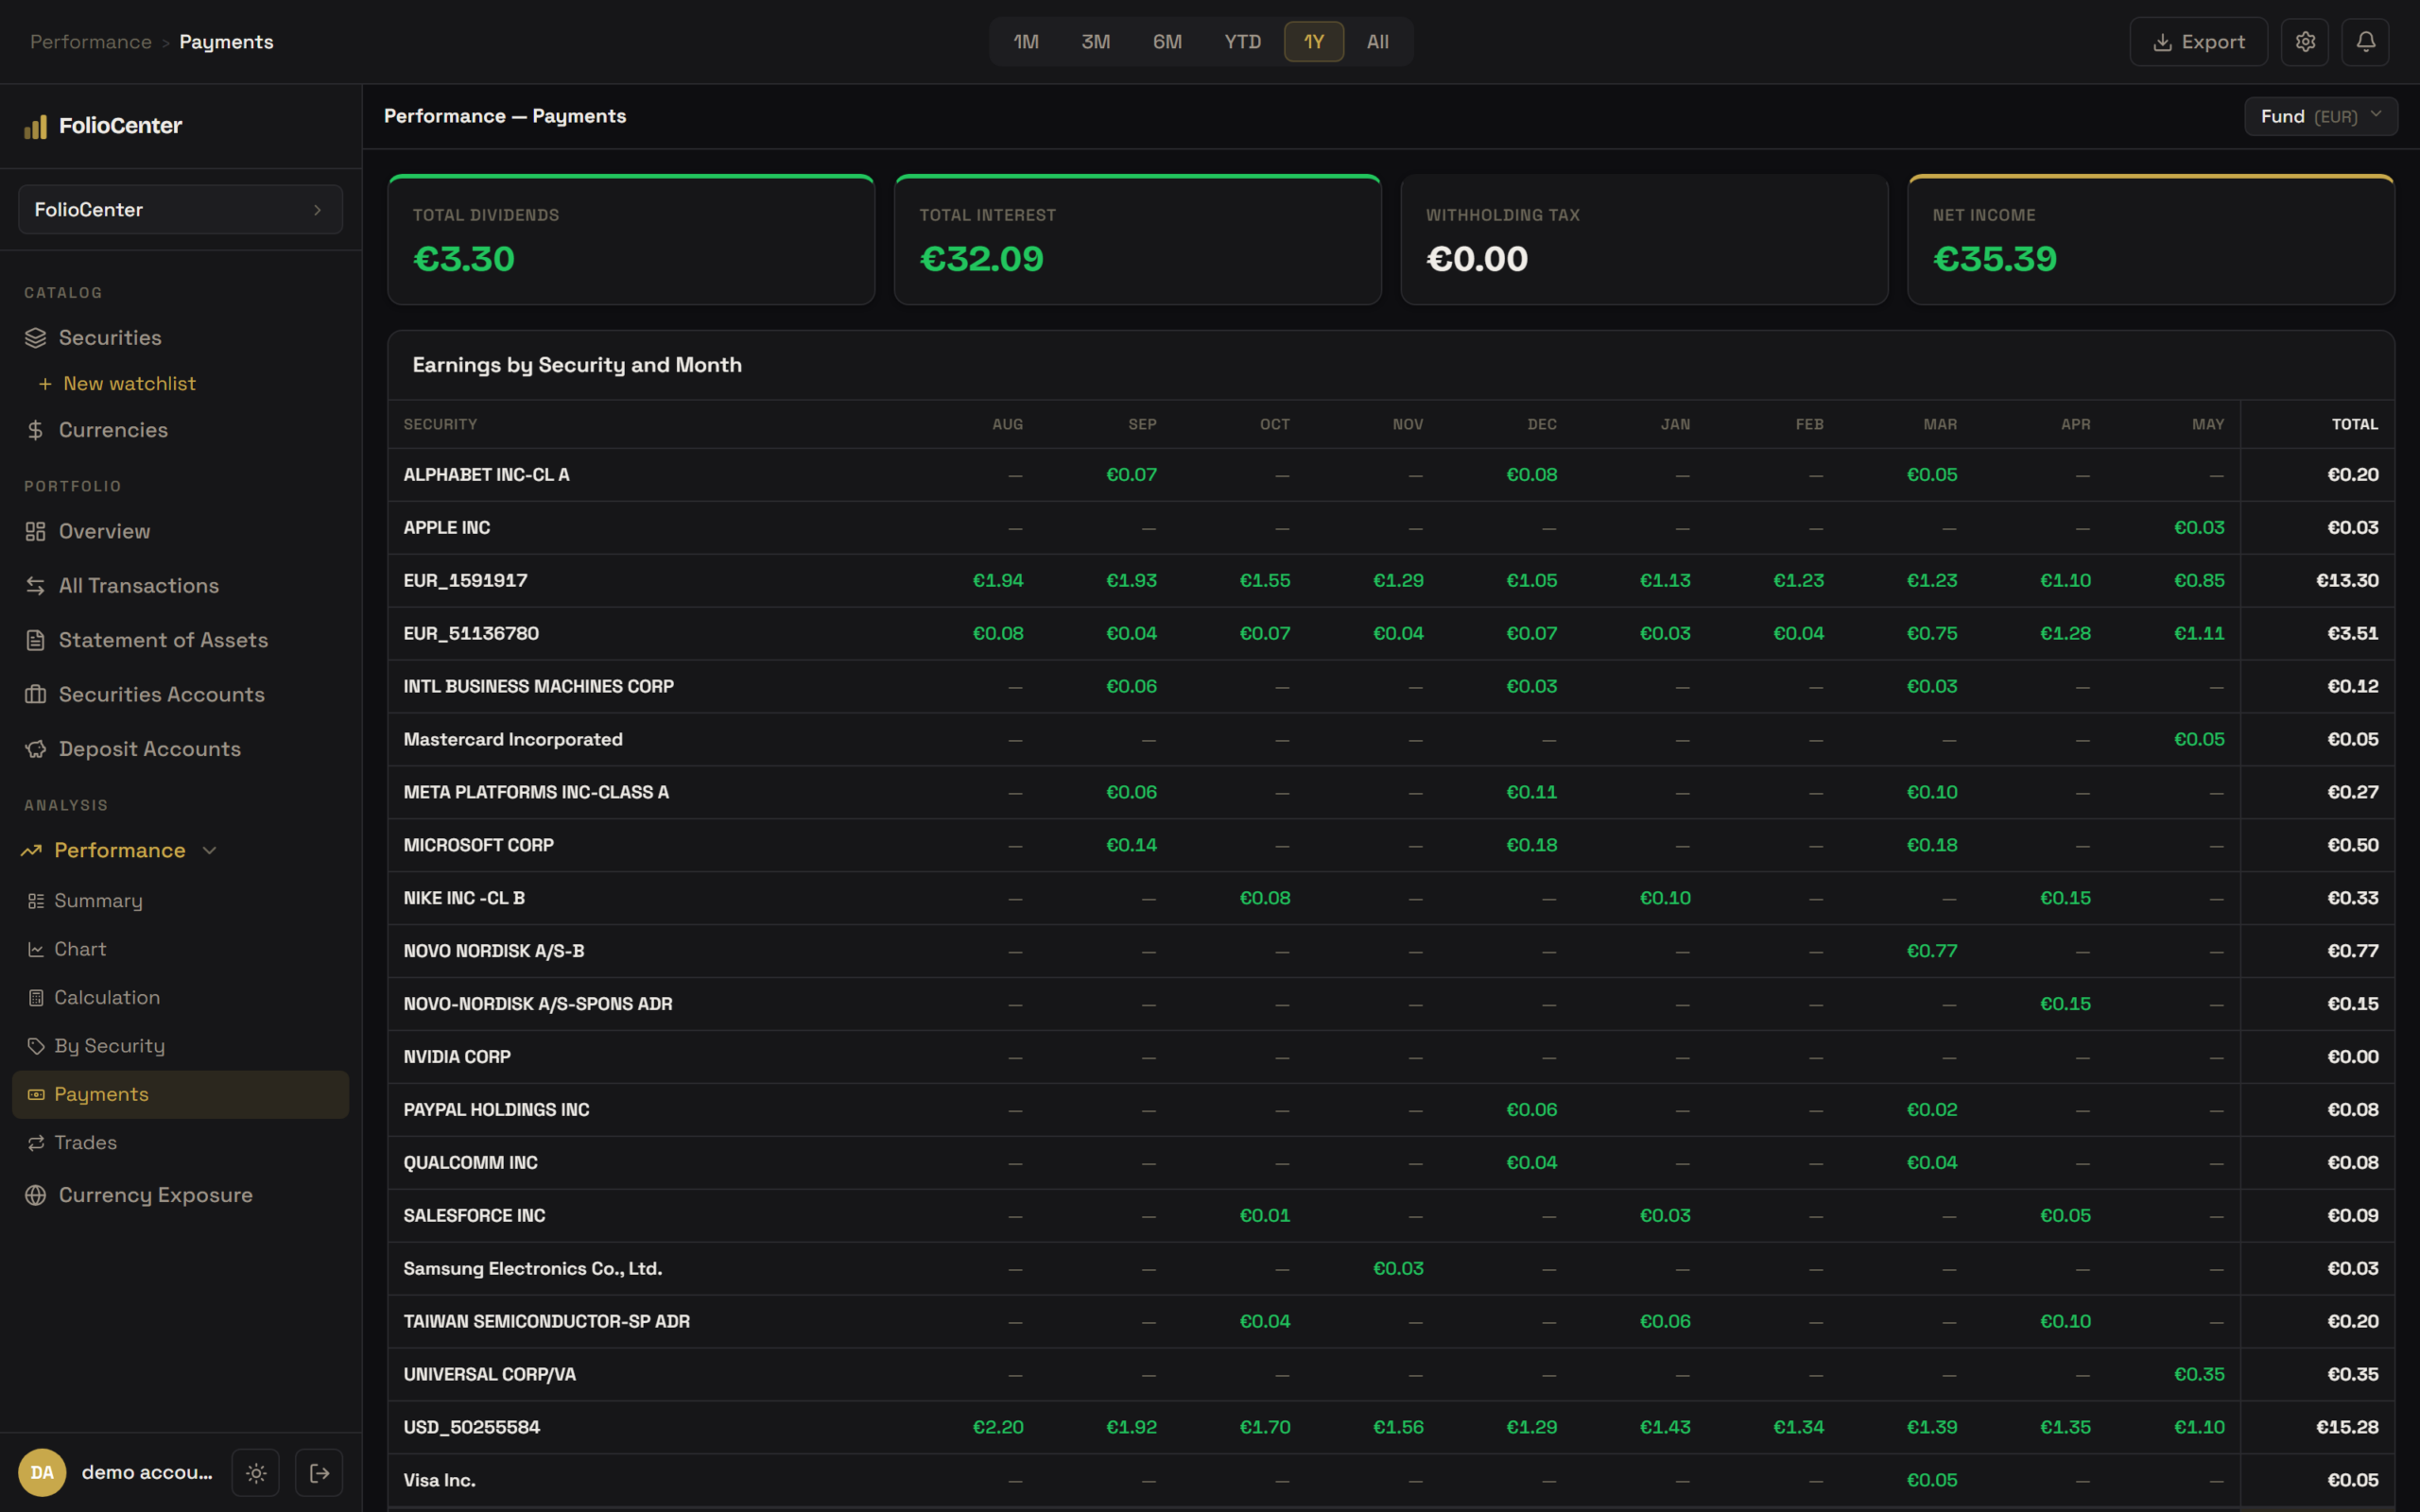
Gross / tax / net
Know what you actually keep, not just what you were paid.
Month by month
Earnings by security and month, to spot seasonality and concentration.
All income
Dividends, interest, coupons and fees in one view.
Security research.
Financials, earnings, forecasts and dividends for every company you own or follow — next to your own position.
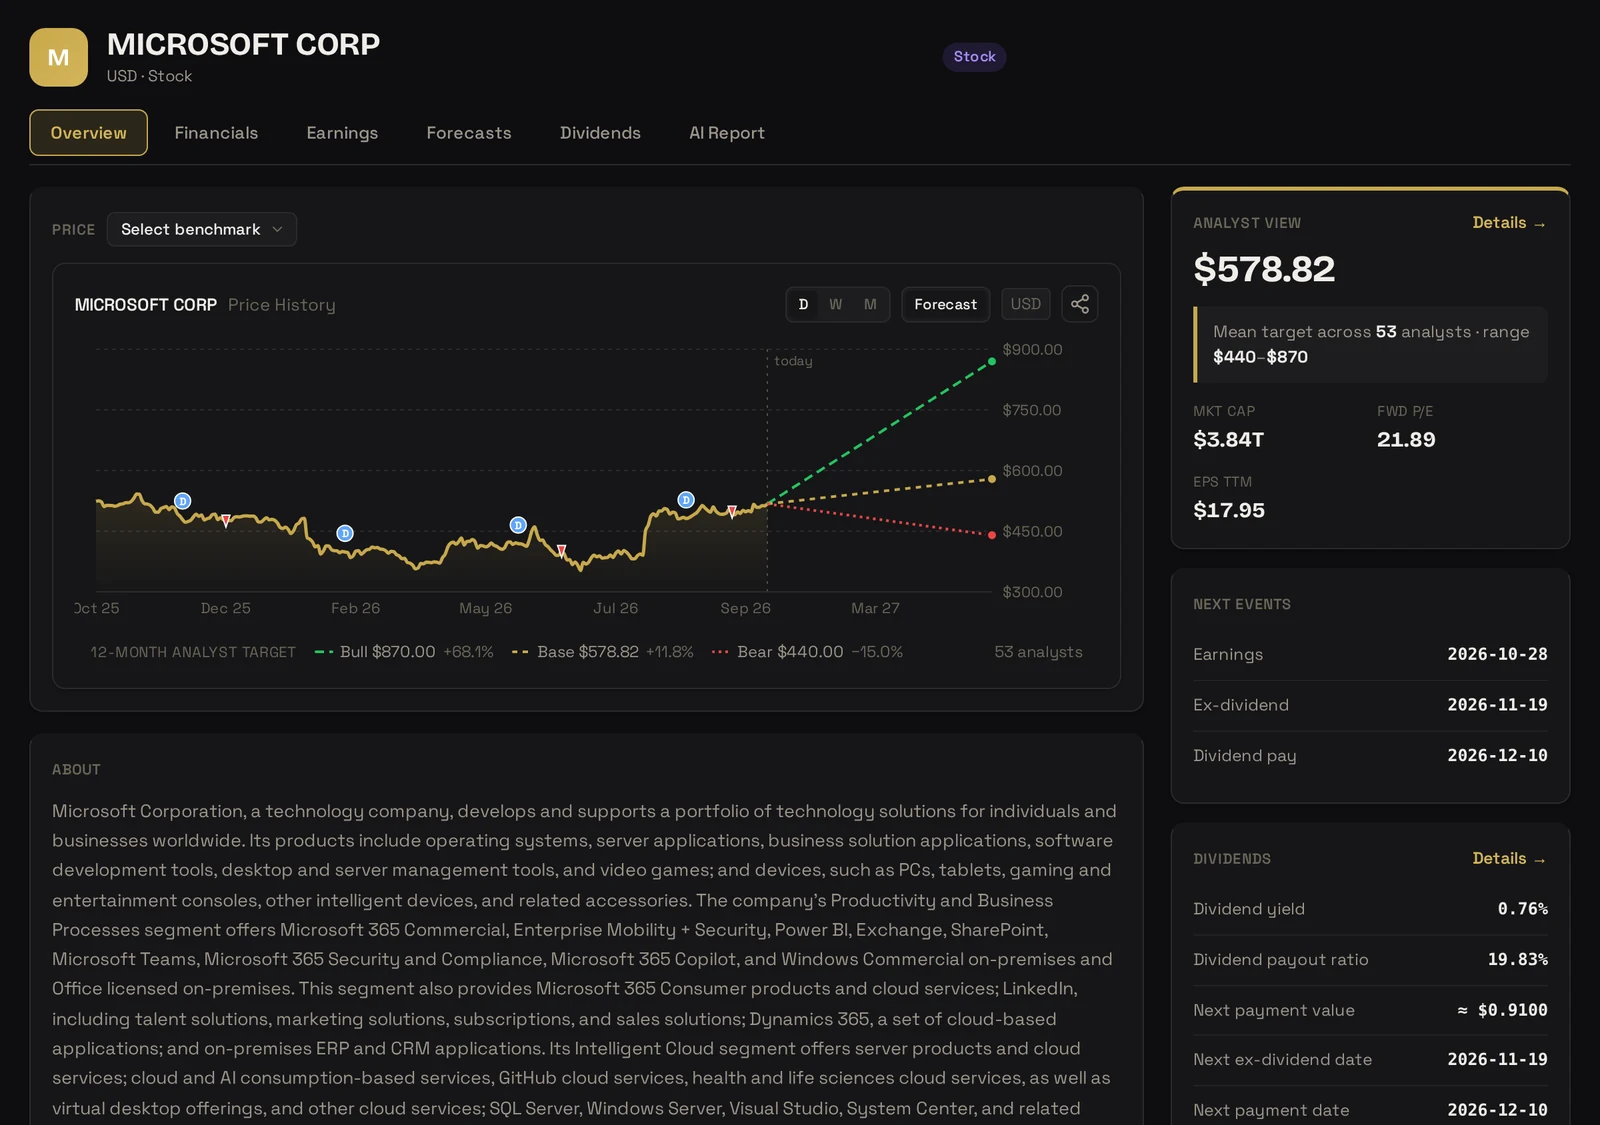
Analyst view
Mean target, full range and how many analysts stand behind it.
P/E, four ways
Trailing and forward, on one chart.
What’s next
Earnings, ex-dividend and payment dates.
AI Security Reports.
An analyst-style research report on any company — sourced, balanced, and with your own portfolio in mind.
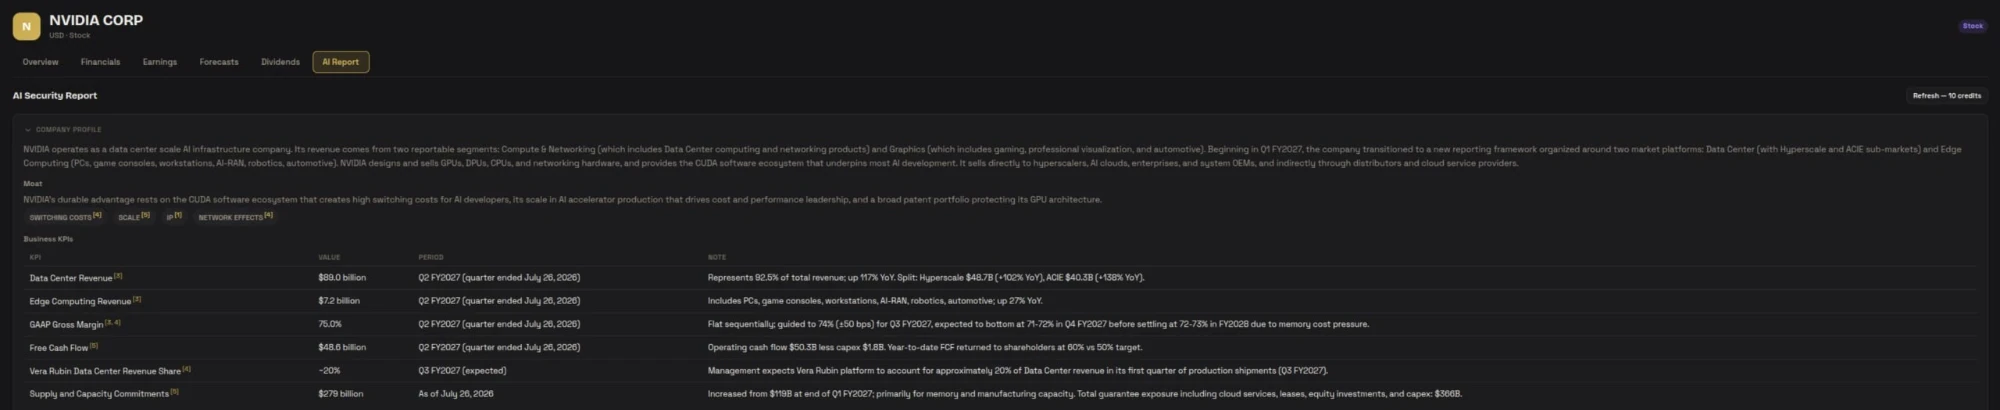
Catalysts & scenarios
What moved the company, and what could next.
Seven lenses
Value to Technical — and where they disagree.
Your fit
How it sits in your portfolio and against your benchmark.
A complete 25-page sample PDF report on NVIDIA — no sign-up needed.
Currency exposure.
How much of your wealth depends on each currency — across every account and broker.
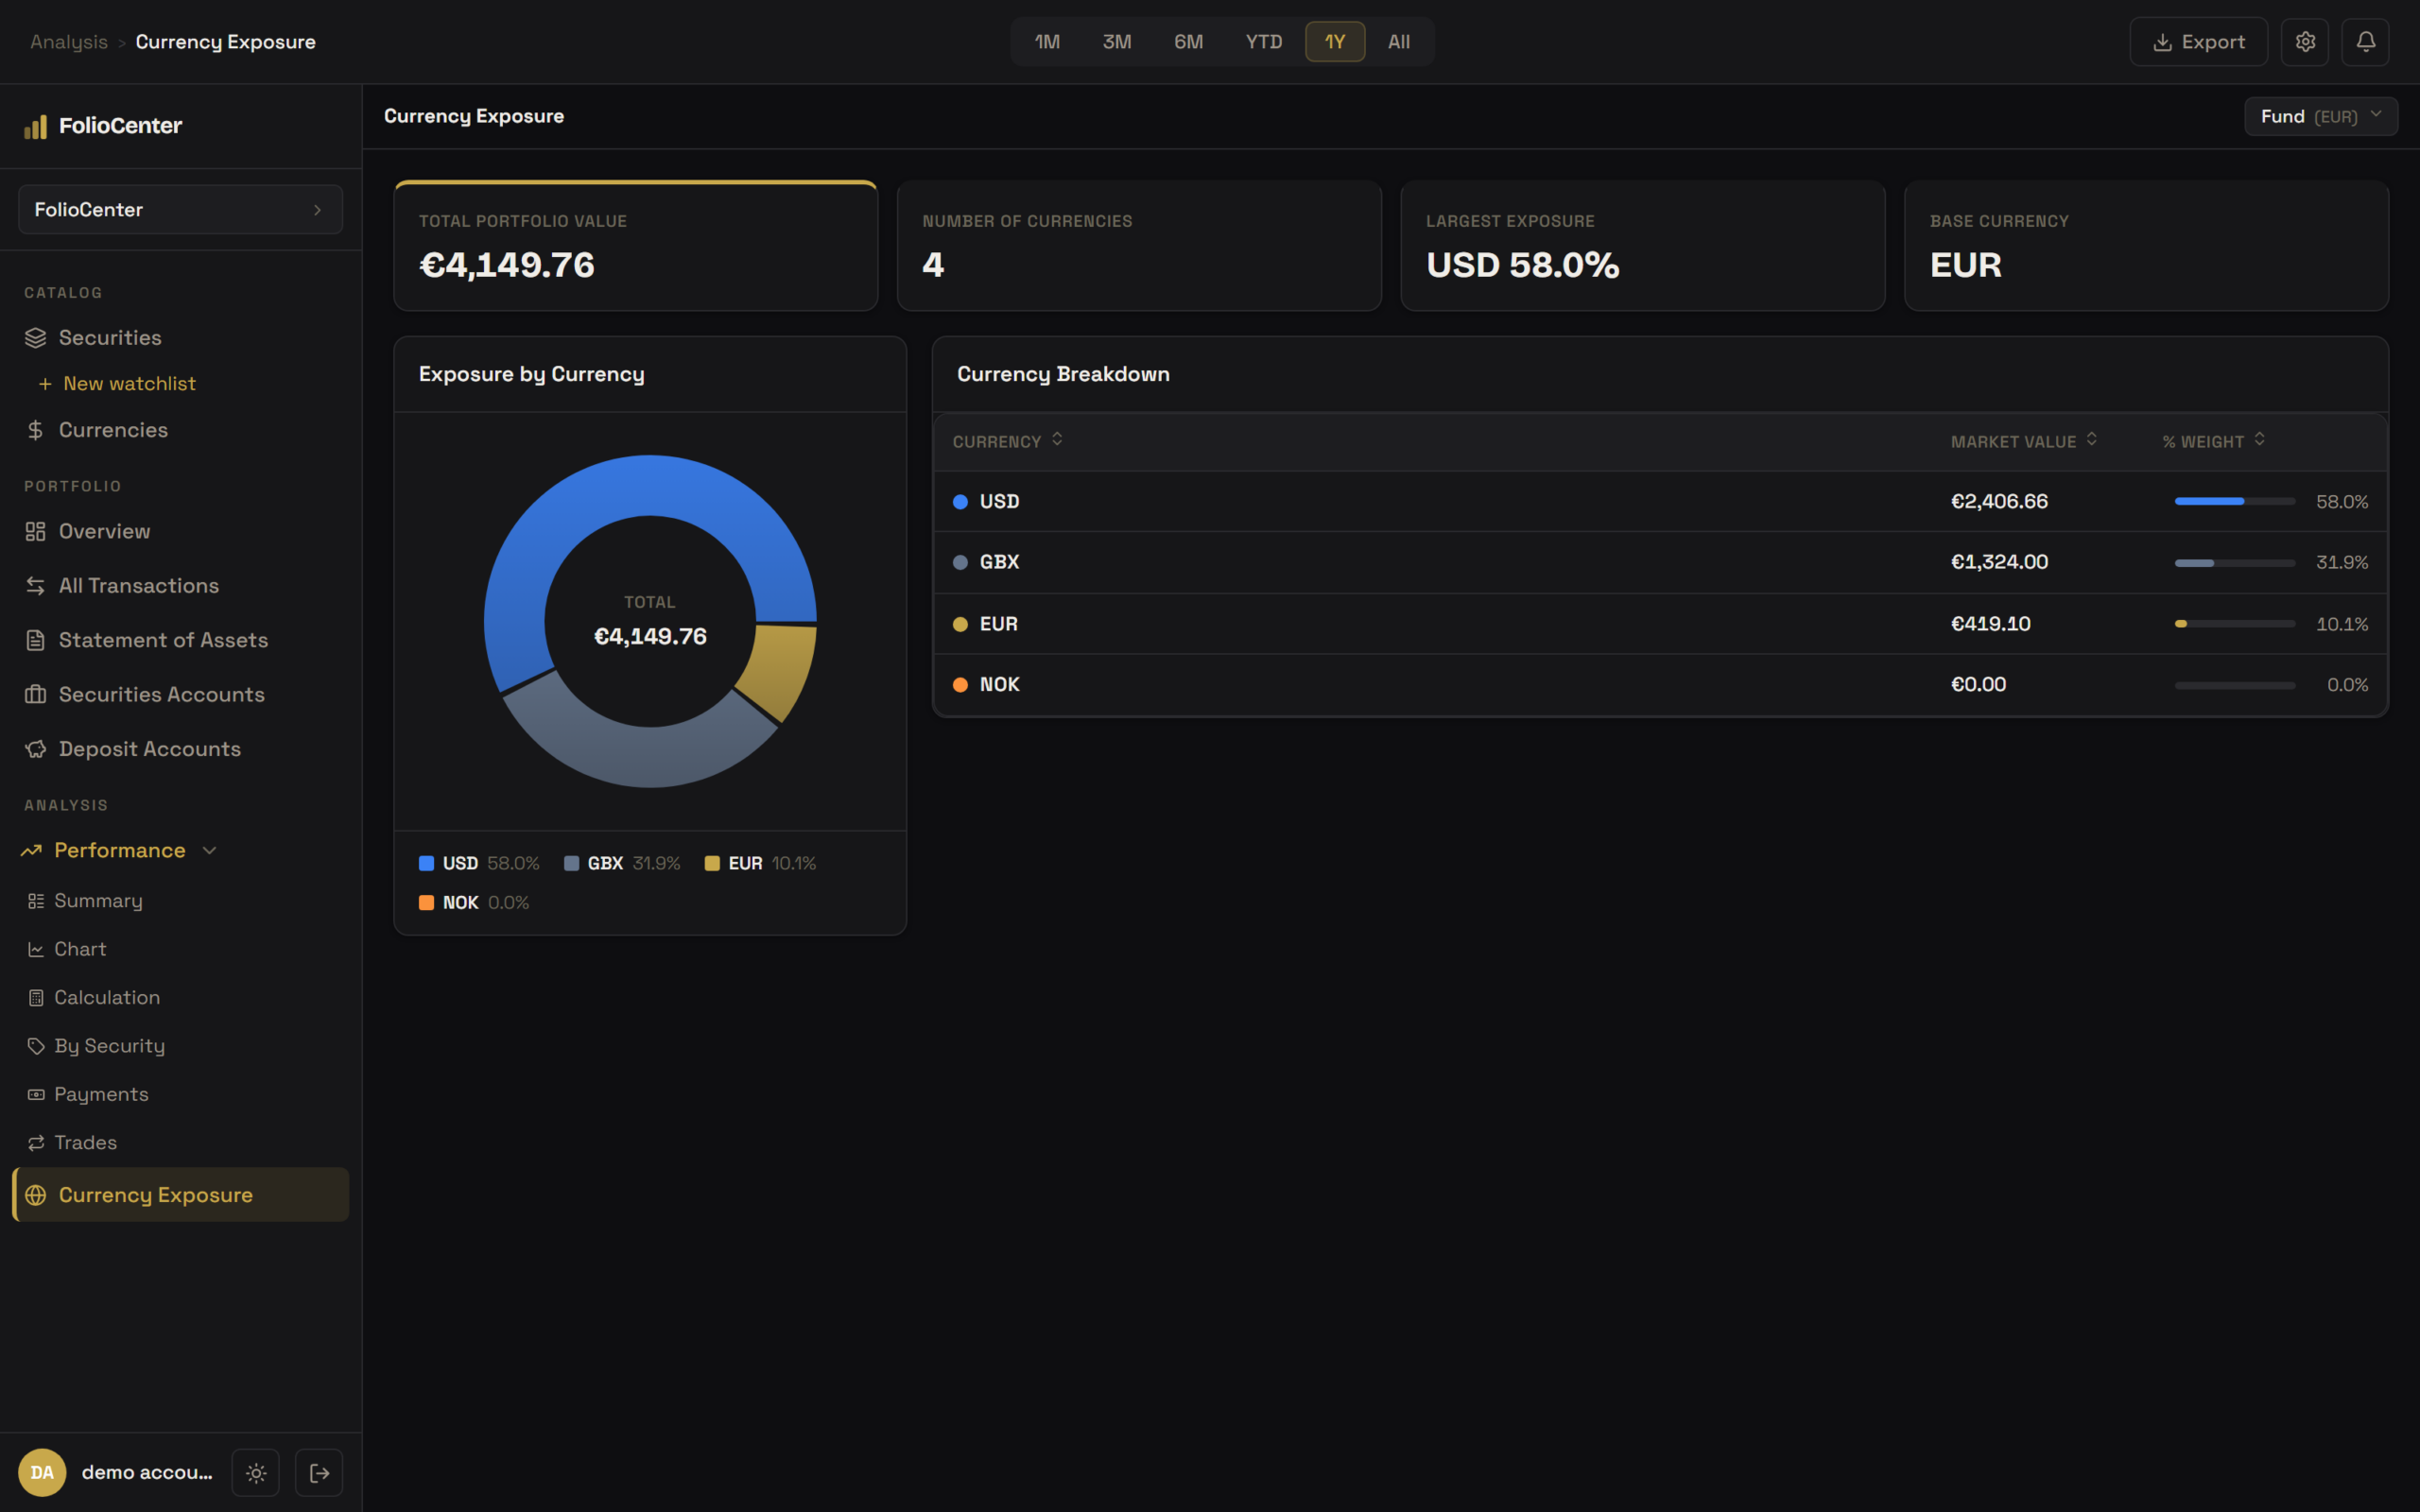
Every currency
Exposure by currency across all your accounts.
Largest exposure
The currency you depend on most, highlighted.
Daily FX
Everything valued in your base currency, every day.
Allocation & rebalancing.
Carve your portfolio any way you like, set targets, and see the trades that get you back on track.
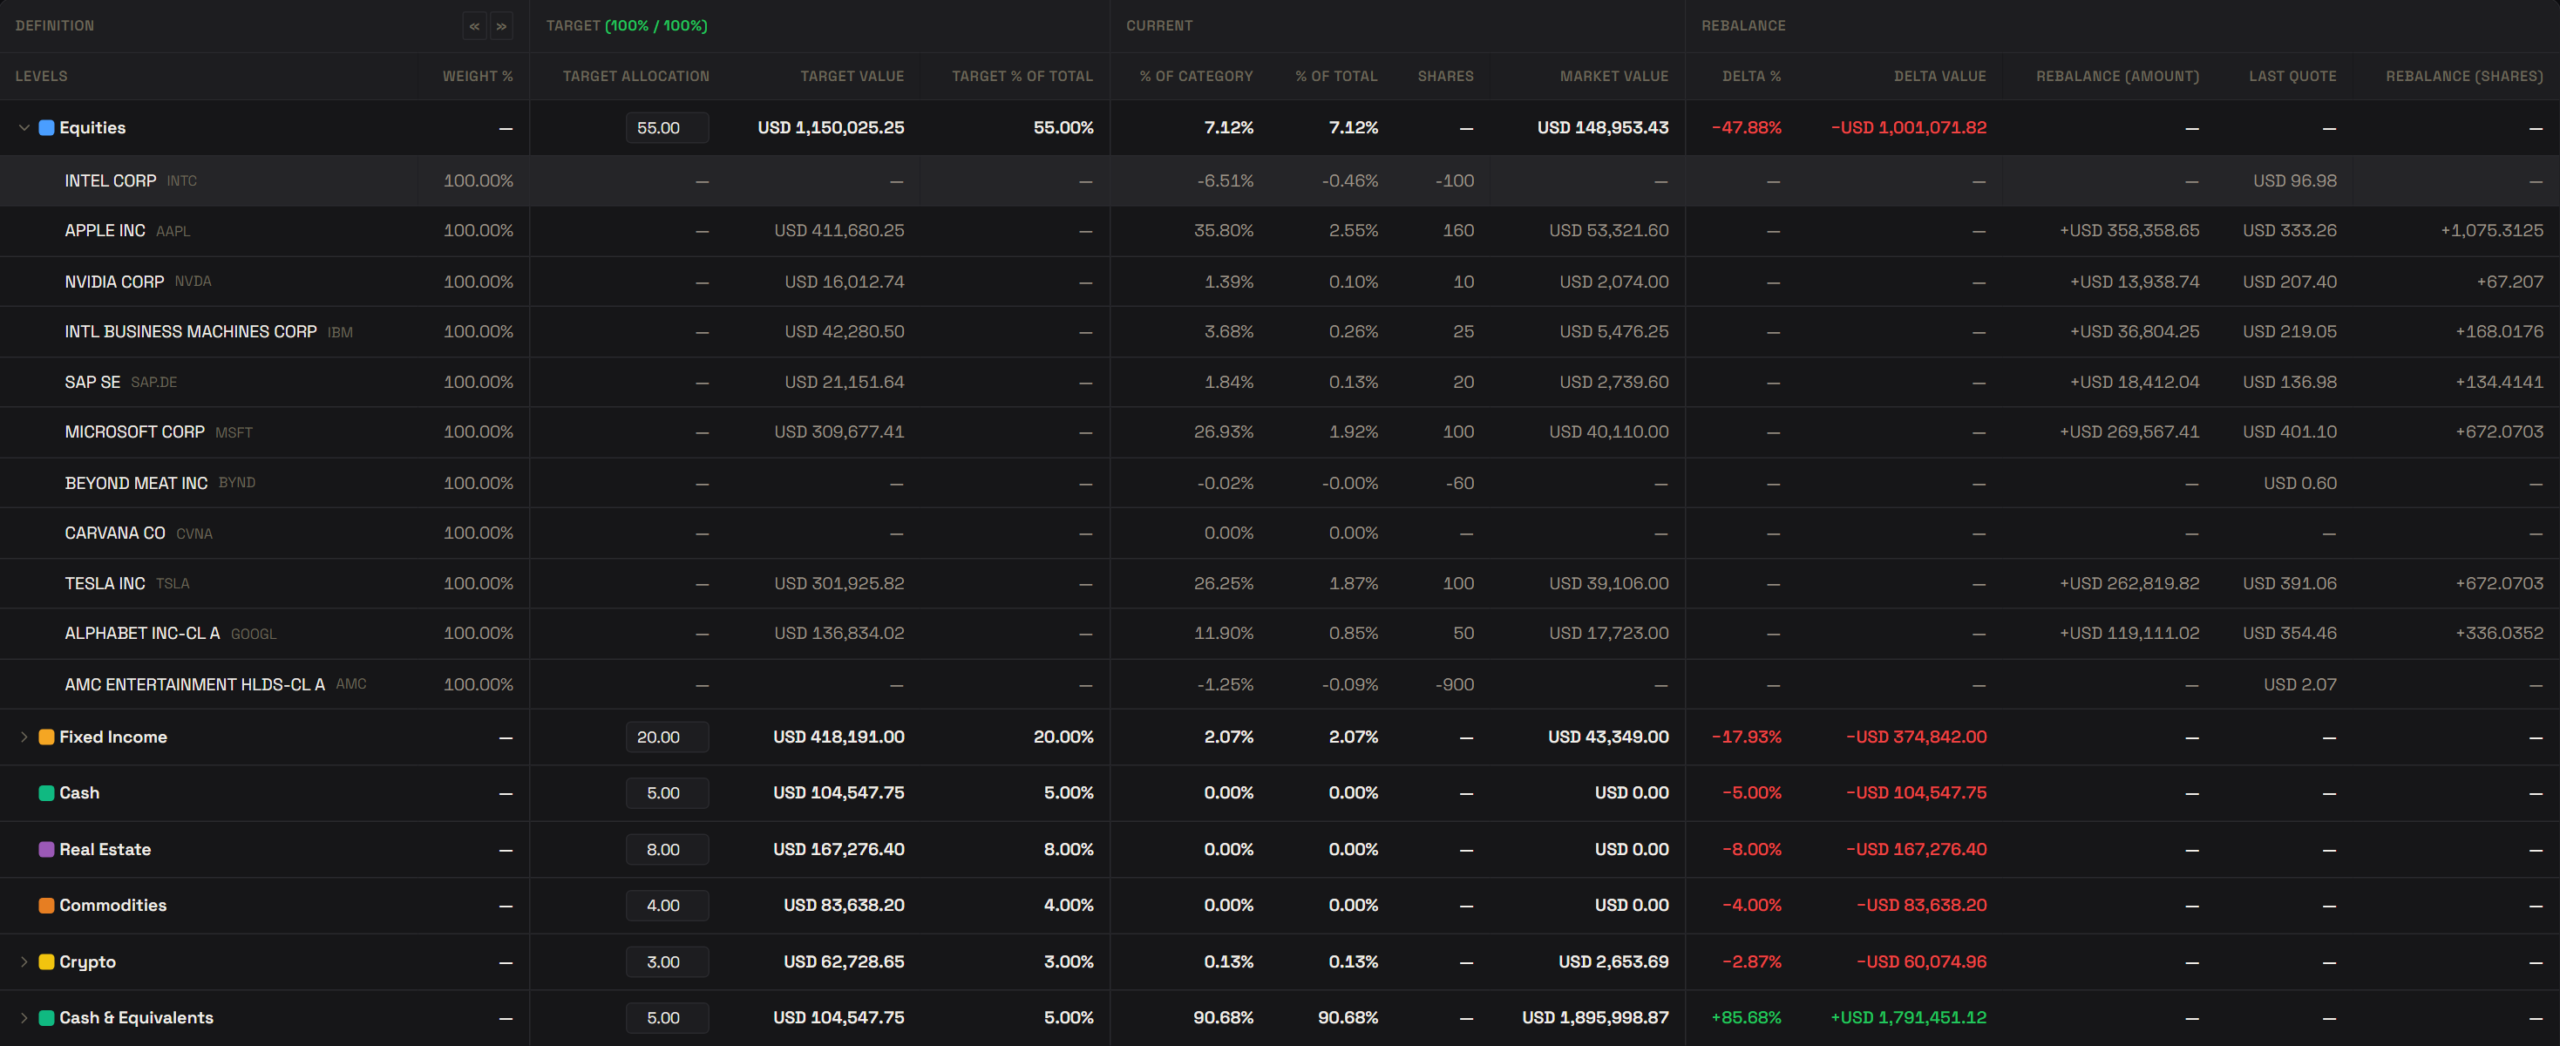
Your categories
Asset class, region, sector, theme — as many views as you need.
Targets at every level
Set weights per category; drift is calculated for you.
The exact trades
Amount and shares to buy or sell, per holding.
Savings & equity pay.
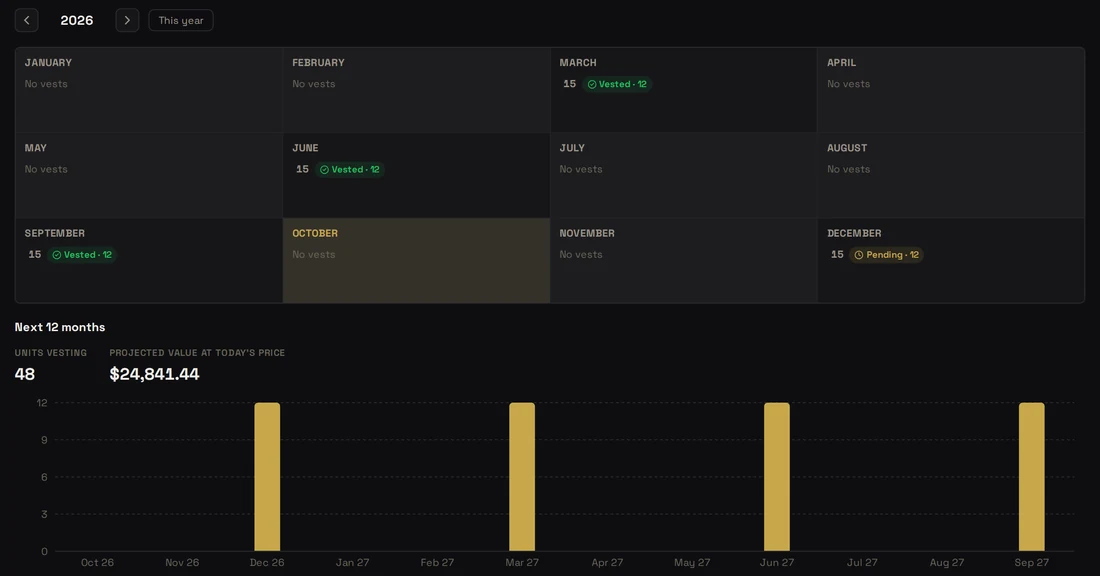
Savings accounts, term deposits and RSU grants — tracked next to your investments.
Interest worked out
Rates, tiers and tax — booked on the day it’s paid.
Every vest recorded
Value, tax and sell-to-cover, ready for tax season.
What’s coming
A calendar of the next twelve months of vests.
Imports · broker statements.
Drop a file, pick the broker, done.
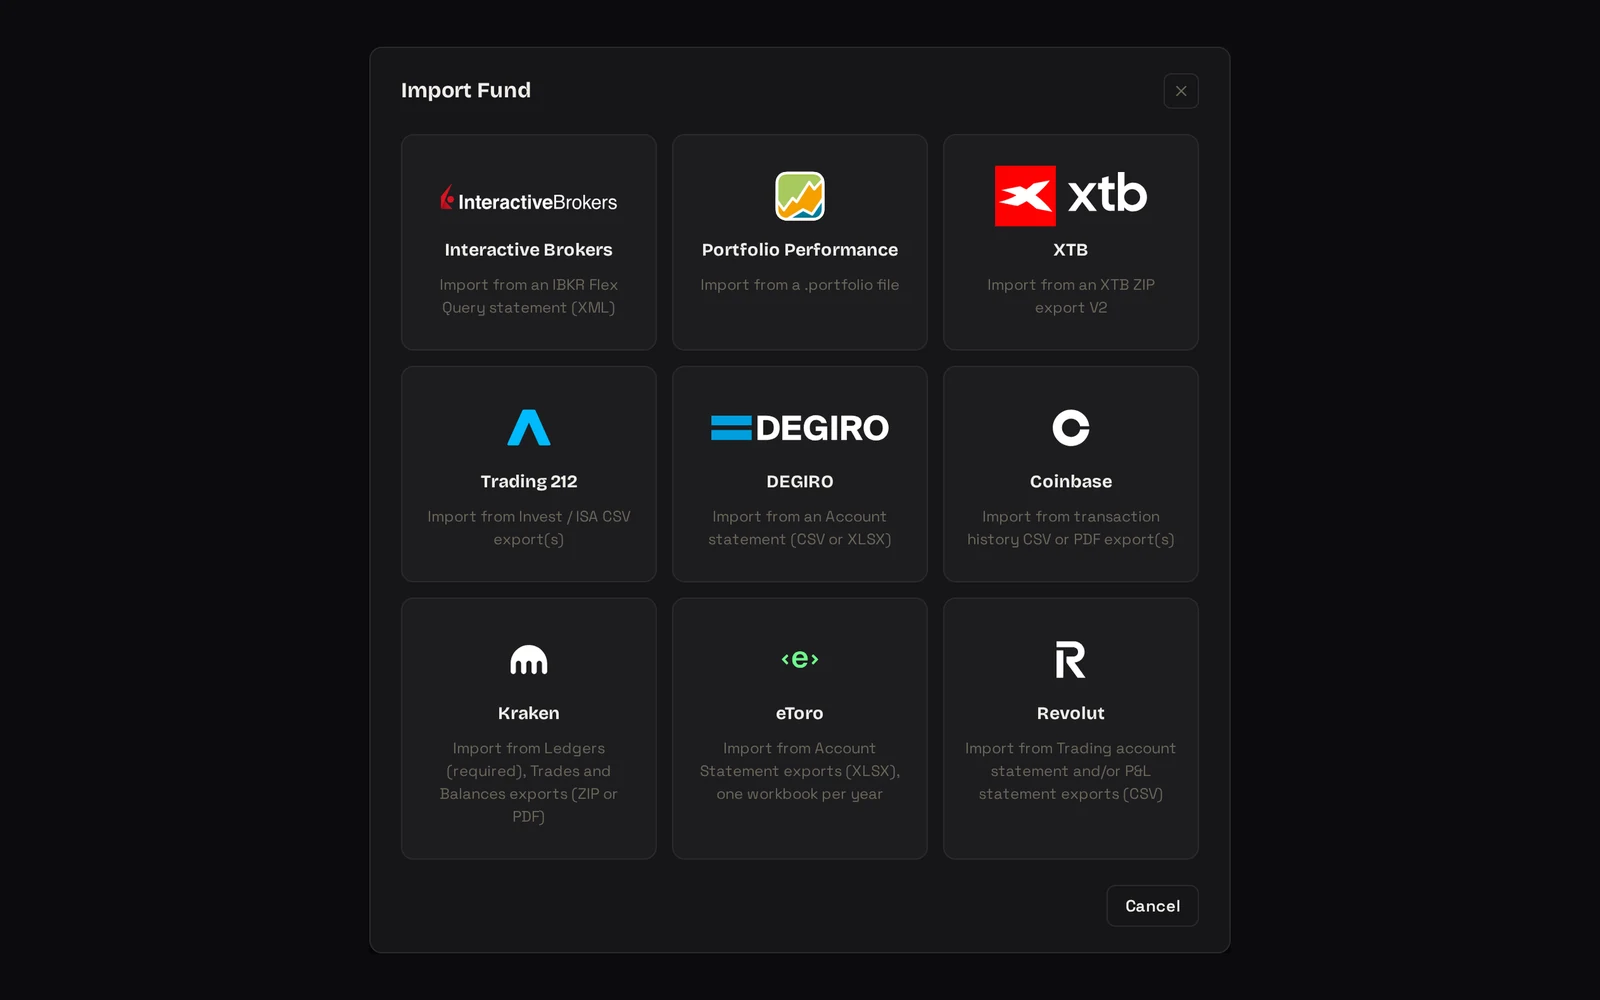
Built for each broker
Every major broker has its own importer — not a generic CSV.
Safe to repeat
Re-import any time; nothing is ever counted twice.
Easy to switch
Coming from Portfolio Performance? Your history imports in one file.