Benchmarks: compared with what?
A return means nothing on its own. Up 12% is excellent, ordinary or disastrous depending entirely on what the alternative was — and choosing that alternative well is most of the work.
Why a benchmark at all
Every euro in your portfolio had somewhere else it could have been. A benchmark makes that alternative explicit: it is the return you could have had by doing the obvious, cheap, passive thing instead. Measured against it, your decisions — which holdings, what weights, when you bought — either added something or did not.
Without one, a portfolio can only be judged against zero, which flatters every position in a rising market and condemns every position in a falling one. A year of +18% feels like skill until the index you could have bought for a few basis points returned +24%. The number that matters is rarely the return; it is the difference.
Global, national, regional — picking the yardstick
The benchmark has to resemble what you actually hold, or the comparison measures the mismatch rather than your decisions. Three broad tiers cover most needs.
Global — MSCI World or an all-world fund. The right default for a diversified portfolio spread across countries, and the honest answer to “could I have just bought everything?”
National or continental — the S&P 500, the STOXX Europe 600, the Nikkei 225. Appropriate when your book genuinely concentrates there. Comparing a European portfolio to the S&P 500 mostly measures the gap between two economies and two currencies, not your stock picking.
Regional and country — the PSI 20 for a Portuguese book, the IBEX 35 for a Spanish one, the BEL 20, the AEX, the OMX Stockholm 30. These matter to investors whose holdings, salary and spending all sit in the same small market. A Lisbon-based investor holding Portuguese banks and utilities learns far more from the PSI 20 than from a world index, because it isolates the decisions that were actually theirs to make.
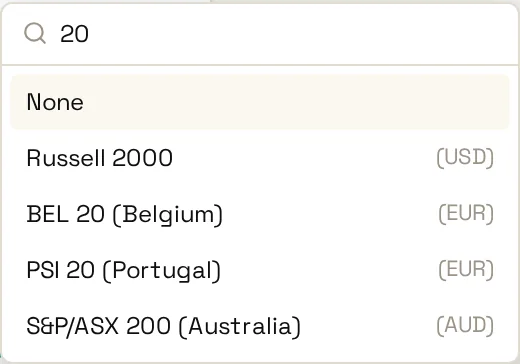
Currency is handled for you. Each benchmark is quoted in its own currency — the PSI 20 in EUR, the S&P 500 in USD, the Nikkei in JPY — and the picker shows which. Before comparing, FolioCenter converts the benchmark into your portfolio’s currency (or, on a security’s chart, into that security’s currency), day by day. The benchmark line is therefore what you would actually have earned holding it as a euro — or dollar — investor: the honest alternative to your own decisions.
That also means the comparison carries the benchmark’s currency movement. In 2025 a euro investor in the S&P 500 earned far less than the headline dollar return, because the dollar weakened over the year. If you want to see how much of a gap is currency, compare against a benchmark quoted in your own currency as well.
The four numbers
Pick a benchmark and FolioCenter computes four figures over the period you are viewing. They answer different questions and are worth reading together rather than one at a time.
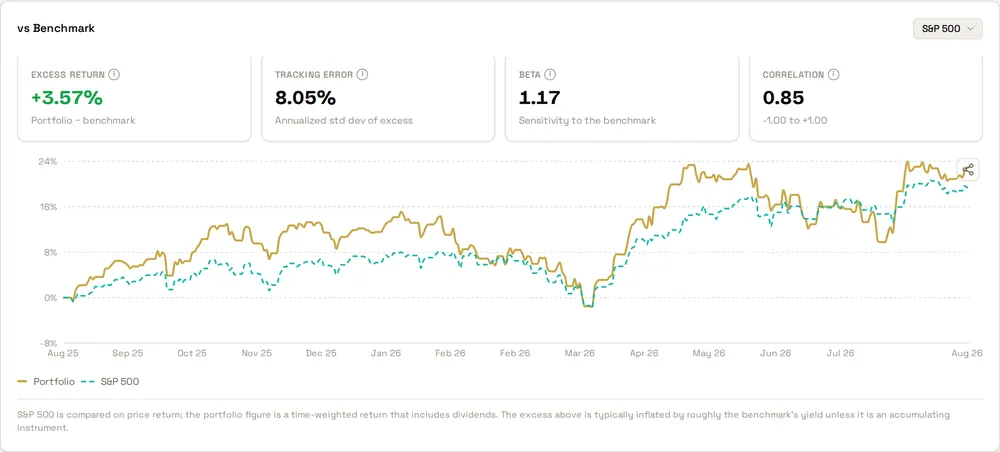
Excess return is the headline: your time-weighted return minus the benchmark’s over the same window. Tracking error is the annualised standard deviation of the daily difference — how far your portfolio wanders from the benchmark day to day. A low tracking error means you are effectively holding the index; a high one means you are doing something genuinely different, for better or worse.
In the comparison above, +3.57% excess against a tracking error of 8.05% says the portfolio finished ahead, but by less than the amount it routinely diverges in a year. That is worth knowing before treating the outperformance as settled.
Beta and correlation answer different questions
They are easy to confuse and they are not measuring the same thing.
Correlation (−1.00 to +1.00) asks how reliably you move together. It says nothing about size. Beta asks how far you move for each unit the benchmark moves: 1.00 matches it, above 1.00 amplifies, below 1.00 dampens.
The example above reads 0.85 correlation with a beta of 1.17: the portfolio moves with the S&P most of the time, and when it moves it moves about 17% harder. That is a leveraged version of the same broad exposure, not a genuinely different one.
One trap worth remembering: beta is only meaningful when correlation is high. A beta computed against a benchmark your holdings barely track is arithmetic without meaning — the ratio still returns a number, but it describes almost nothing. Read correlation first, and treat beta as informative only once correlation is comfortably high.
Price return vs total return — the caveat that changes the maths
This one is worth understanding before reading any excess return, and FolioCenter states it under the chart rather than burying it.
Most indices are price indices: they track share prices and ignore dividends. Your portfolio’s return, by contrast, is a time-weighted return that includes the dividends you received. Comparing the two is therefore structurally flattering to you, by roughly the benchmark’s dividend yield — often a percent or two a year. An excess return of +2% against a price index yielding 2% is, in substance, a draw.
The exceptions are the accumulating funds in the catalogue — MSCI World (IWDA) and MSCI Emerging Markets IMI (EIMI) — whose prices already embed their distributions. Compared against those, the excess figure is genuinely like-for-like. If you care about a clean number, prefer an accumulating benchmark; if you use a price index, mentally deduct its yield before congratulating yourself.
Benchmarking a single holding
The same comparison is available on any individual security, and it answers questions a portfolio-level number cannot:
- Is this holding actually pulling its weight? A stock that trails its home index over years is a decision to revisit, however well the whole portfolio is doing.
- Am I paying for diversification I am not getting? A holding with 0.95 correlation to an index you already track is, in practice, more of the same. Correlation is the cheapest diversification check there is.
- Was that a company story or a market story? If a holding fell 20% while its index fell 18%, almost nothing happened that was specific to the company.
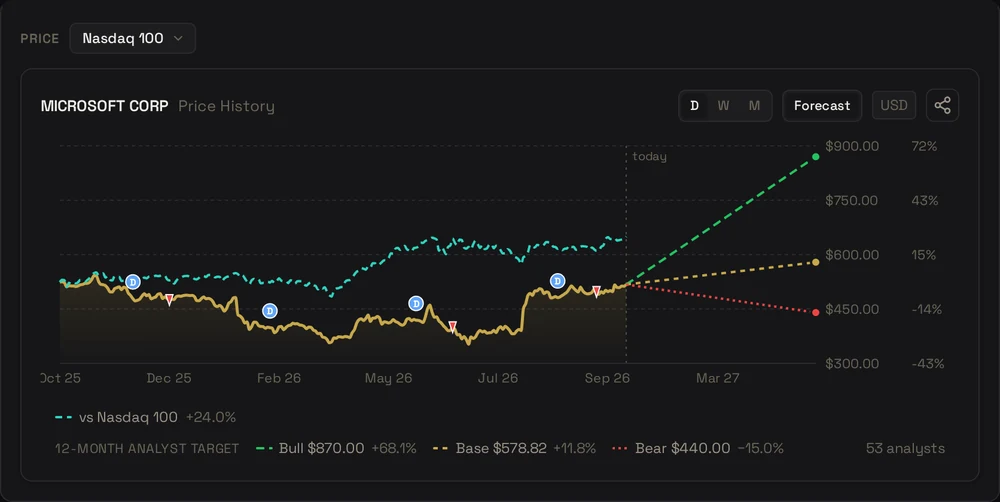
Comparing a single security against a regional index is often the more revealing test. A Portuguese utility measured against MSCI World tells you mostly about global equity; measured against the PSI 20 it tells you how it fared against the companies it genuinely competes with for local capital.
For a deeper look at one holding, an AI Security Report measures it against your chosen benchmark over several windows and adds upside and downside capture — how much of the benchmark’s rises, and of its falls, the security has tended to share.
The benchmarks available today
Thirty-three benchmarks are available right now, grouped by region and searchable by name, country or currency. Twenty-seven are pure indices; a handful are tracked through a liquid ETF where no clean index series exists, and those are labelled as such. The catalogue is maintained and keeps growing — if an index matters to your market and is missing, it is a candidate for the next addition.
MSCI World (IWDA, accumulating) · MSCI Emerging Markets IMI (EIMI, accumulating) · Bloomberg Global Aggregate Bond (AGGG)
S&P 500 · Dow Jones Industrial Average · Nasdaq 100 · Russell 1000 · Russell 2000 · Russell 2500 (SMMD ETF) · Russell 3000
EURO STOXX 50 · STOXX Europe 600 · DAX 40 (Germany) · FTSE 100 (UK) · CAC 40 (France) · SMI (Switzerland) · AEX (Netherlands) · IBEX 35 (Spain) · FTSE MIB (Italy) · BEL 20 (Belgium) · OMX Stockholm 30 (Sweden) · PSI 20 (Portugal)
Nikkei 225 (Japan) · KOSPI (South Korea) · Hang Seng (Hong Kong) · SSE Composite (China) · NIFTY 50 (India) · S&P/ASX 200 (Australia)
S&P/TSX Composite (Canada) · IBOVESPA (Brazil) · IPC (Mexico)
Gold (SPDR Gold Shares) · Bitcoin
Measure your portfolio against the market
Pick from dozens of global, national and regional benchmarks and see whether your decisions are adding value.
Start free →Already have an account? Sign in
Comparison figures — excess return, tracking error, beta and correlation — and the benchmark line on a security’s price chart, are part of FolioCenter Plus; the benchmark catalogue and the picker are visible on every plan. Benchmarks are a tool for asking better questions about your own decisions, not a verdict on them, and nothing here is investment advice.