Plan a rebalancing
The Rebalancing tab compares what a taxonomy currently holds against target weights you choose, and computes how far each category is off and what trades would close the gap. FolioCenter does the arithmetic; the targets are entirely yours.
What the Rebalancing tab does
The Rebalancing tab takes the categories from a taxonomy and lets you type a Target Allocation for each. It then shows, side by side, three groups of columns: your Target (allocation, value and % of total), your Current holdings (% and value), and the Rebalance gap between them (the delta, plus the trades that would close it).
You choose the targets; FolioCenter does the arithmetic. The tab never suggests an allocation or tells you what to hold. It only measures the distance between your current portfolio and the targets you enter, and turns that distance into amounts and share counts.
You’ll need a taxonomy with categories first — see Organize holdings with taxonomies. Then open Analysis → Taxonomy → your taxonomy, and choose the Rebalancing tab.
Set target allocations
Each category has a Target Allocation field — its share of its own level. The siblings at any one level should sum to 100%. The group header shows the running top-level total and colours it: green at 100%, red above, blue below. Any field whose level doesn’t total 100% is flagged so it’s easy to spot.
- Type a target for each top-level category so they sum to 100%.
- Expand a category and set targets for its sub-categories — they sum to 100% within that parent.
- Watch the header total confirm the top level is balanced.
Targets nest automatically. A category’s Target % of Total is its allocation multiplied down through its parents — Fixed Income at 20% with Bonds set to 80% of that works out to 16% of the whole portfolio.
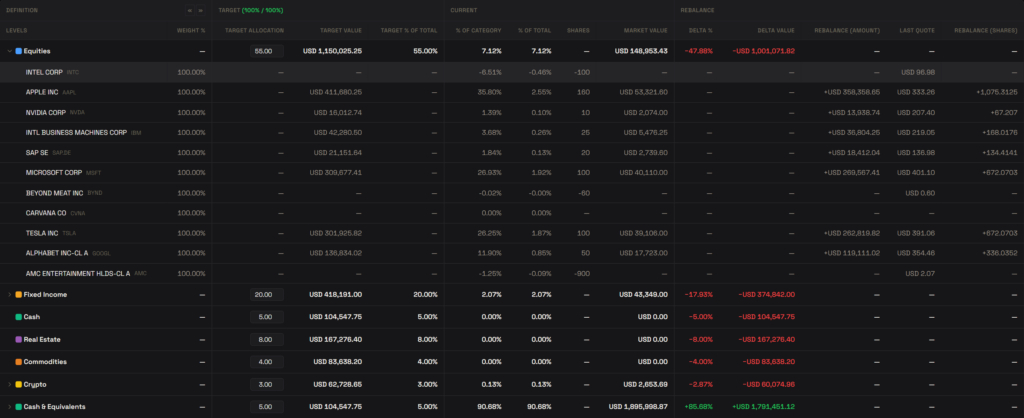
Read the numbers
- Target Value — your Target % of Total × the value of the classified holdings; the money a category would hold at target.
- Delta % and Delta Value — Current minus Target. Positive (green) means the category currently sits above its target; negative (red) means below. This is the size of the gap, not a judgement about it.
Categories show the deltas; individual holdings show the trades.
The projected trades
Expand a category and each holding shows two more figures:
- Rebalance (Amount) — the buy (+) or sell (−), in the fund’s base currency, that moves the holding toward its category’s target while keeping the current proportions between holdings inside that category.
- Rebalance (Shares) — that amount divided by the holding’s last quote. Cash and anything without a usable price show “—”.
Projections, not instructions. These figures are a mechanical calculation from current prices and the targets you entered. They are not order instructions or investment advice, and FolioCenter does not place trades. Review them, decide for yourself, and remember prices move — recheck before acting.
How the maths works
Every figure derives from one input you control — each category’s Target Allocation — plus your current holdings:
- Basis = the total market value of your classified holdings. Cash & Equivalents is included; the synthetic Unclassified bucket is excluded — so classify what you want counted first.
- Target % of Total cascades: each category’s allocation × its ancestors’ allocations.
- Target Value = Target % of Total × basis.
- A holding’s target = its current share of its category × the category’s Target Value; Rebalance Amount = target − current; Rebalance Shares = amount ÷ last quote.
Tips for a clean setup
- Make each level’s siblings sum to 100% — the header colour confirms the top level at a glance.
- Classify the holdings you want measured; the Unclassified bucket is left out of the basis.
- The Rebalancing tab shares its taxonomy with the Definition and chart tabs — the same categories and colours.
- Targets are saved on the taxonomy, so they persist between sessions and export with it.
Common questions
No. You type every target yourself. The tab only measures the gap between your current holdings and the targets you set — it makes no recommendation about allocations or trades.
Each level’s siblings should total 100%. The header shows the running sum — green at 100%, red over, blue under — and flags any field whose level is off.
No. Every figure is a projection. FolioCenter never executes trades; the Rebalance amounts and shares are yours to review and act on however you choose.
It’s the Rebalance Amount divided by the holding’s last quote. Cash and anything without a usable price show “—”.
Cash & Equivalents is counted in the basis; the derived Unclassified bucket is excluded. Classify a holding first if you want it included in the targets and trades.
On the taxonomy itself, so they persist across sessions and travel with the taxonomy when you export it.
Prerequisite: a rebalancing needs a taxonomy to work from. If you haven’t built one yet, start with Organize holdings with taxonomies.